GPS Accuracy of Garmin, Polar, and other Running Watches
I evaluated the real world accuracy of GPS watches while running over 6,000 miles/9,600Km and recording over 25,000 data points as part of my evaluation of the Best Running Watches. Under good conditions most of the watches are remarkably good, but when things get a little tough the differences become more apparent. However, none of the watches have GPS accuracy that is good enough to be used for displaying your current pace. For current pace, the only viable option is to use a Footpod, and my review of running watches lists those that can display current pace from a Footpod while still using GPS for your course.
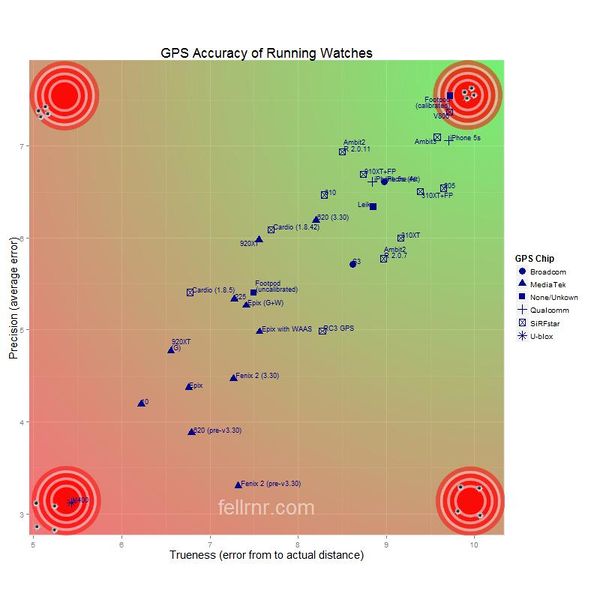
The table below is a simplified summary of the results, where a '10' would be a perfect device. (For an explanation of the ISO 5725 terms 'trueness', 'precision' and 'accuracy', see below.)
| Device | Accuracy | Trueness | Precision | Repeatability | Chipset Make | Chipset Model or Architecture | Review | Rank |
|---|---|---|---|---|---|---|---|---|
| Stryd Footpod (uncalibrated) | 9.4 | 9.7 | 9.2 | 9.3 | None | None | Stryd Review | 1 |
| Adidas Speed Cell FP (calibrated) | 8.6 | 9.7 | 8.0 | 8.2 | None | None | Footpod | 2 |
| Garmin Footpod (calibrated) | 8.2 | 9.7 | 7.5 | 7.6 | None | None | Footpod | 3 |
| MilestonePod Footpod (calibrated) | 8.1 | 9.8 | 7.4 | 7.7 | None | None | MilestonePod Review | 4 |
| Polar V800 | 8.1 | 9.7 | 7.4 | 8.1 | SiRFstar | SiRFstarIV | Polar V800 Review | 5 |
| Suunto Ambit3 Run | 7.9 | 9.6 | 7.1 | 7.8 | SiRFstar | SIRFstarV | Suunto Ambit3 Run Review | 6 |
| iPhone 5s | 7.9 | 9.7 | 7.1 | 7.6 | Qualcomm | WTR1605L | Running With A Smartphone | 7 |
| Suunto Spartan Trainer 1.10.28 | 7.8 | 8.8 | 7.2 | 8.0 | MediaTek | MT3339 | Suunto Spartan Trainer Review | 8 |
| Polar Stride Sensor Footpod (calibrated) | 7.7 | 8.5 | 7.0 | 8.0 | None | None | Footpod | 9 |
| Garmin 205 | 7.6 | 9.7 | 6.7 | 7.0 | SiRFstar | SiRFstarIII | 10 | |
| Suunto Ambit2 R | 7.6 | 8.5 | 6.9 | 7.8 | SiRFstar | SIRFstarIV | Suunto Ambit2 R Review | 11 |
| Garmin 910XT | 7.5 | 8.8 | 6.7 | 7.6 | SiRFstar | SIRFstarIV | Garmin 910XT Review | 12 |
| iPhone 4s | 7.5 | 9.0 | 6.6 | 7.2 | Broadcom | BCM4330 | Running With A Smartphone | 13 |
| Garmin 310XT | 7.3 | 9.4 | 6.2 | 6.6 | SiRFstar | SiRFstarIII | Garmin 310XT Review | 14 |
| Leikr | 7.3 | 8.9 | 6.3 | 7.2 | Unknown | Unknown | Leikr Review | 15 |
| Garmin 610 | 7.3 | 8.3 | 6.5 | 7.7 | SiRFstar | SIRFstarIV | Garmin 610 Review | 16 |
| Polar M430 1.0.28 | 7.2 | 8.9 | 6.1 | 7.2 | SiRFstar | SiRFstarIV | Polar M430 Review | 17 |
| Suunto Spartan Ultra | 7.1 | 9.5 | 6.0 | 7.4 | SiRFstar | CSRG0530 (SiRFstarV) | Suunto Spartan Ultra Review | 18 |
| Garmin 620 | 7.1 | 8.2 | 6.2 | 7.2 | MediaTek | MT3333 | Garmin 620 Review | 19 |
| Apple Watch 3 iSmoothRun | 7.0 | 8.9 | 5.9 | 7.0 | Apple | Unknown | Apple Watch 3 Review | 20 |
| Samsung Galaxy S3 | 6.8 | 8.6 | 5.7 | 7.0 | Broadcom | BCM47511 | Running With A Smartphone | 21 |
| Polar M400 v1.9.600 | 6.6 | 8.2 | 5.6 | 7.1 | U-blox | Unknown | Polar M400 Review | 22 |
| Garmin 920XT | 6.6 | 7.5 | 5.9 | 7.5 | MediaTek | MT3333 | Garmin 920XT Review | 23 |
| TomTom Cardio Runner | 6.6 | 7.6 | 5.7 | 7.5 | SiRFstar | SIRFstarV | TomTom Cardio Runner Review | 24 |
| Garmin 225 | 6.2 | 7.3 | 5.4 | 7.1 | MediaTek | MT3333 | Garmin 225 Review | 25 |
| Garmin Fenix 3 | 6.2 | 7.6 | 5.3 | 6.8 | MediaTek | MT3333 | Garmin Fenix 3 Review | 26 |
| Polar RC3 GPS | 6.1 | 8.2 | 4.7 | 5.9 | SiRFstar | SIRFstarIV | Polar RC3 Review | 27 |
| Garmin Fenix 2 | 5.7 | 7.2 | 4.5 | 7.2 | MediaTek | Unknown | Garmin Fenix 2 Review | 28 |
| Fenix 5X 4.30 | 5.6 | 6.9 | 4.5 | 6.8 | MediaTek | Unknown | Garmin Fenix 5X Review | 29 |
| Garmin 935 | 5.6 | 6.8 | 4.6 | 7.2 | MediaTek | Unknown | Garmin 935 Review | 30 |
| Epson SF-810 | 5.4 | 7.3 | 4.1 | 5.7 | Epson | Unknown | Epson SF-810 Review | 31 |
| Garmin Epix | 5.4 | 6.8 | 4.4 | 6.8 | MediaTek | MT3333 | Garmin Epix Review | 32 |
| Garmin 10 | 5.1 | 6.2 | 4.1 | 6.9 | MediaTek | Unknown | Garmin 10 Review | 33 |
| Garmin Vivoactive | 5.0 | 6.2 | 4.1 | 6.6 | MediaTek | Unknown | Garmin Vivoactive Review | 34 |
| Garmin 235 | 4.9 | 6.1 | 4.0 | 6.4 | MediaTek | MT3333 | Garmin 235 Review | 35 |
| Garmin VivoactiveHR | 4.9 | 6.0 | 4.0 | 6.9 | MediaTek | Unknown | Garmin Vivoactive HR Review | 36 |
| Garmin Vivoactive 3 | 4.5 | 5.8 | 3.4 | 6.5 | MediaTek | Unknown | Garmin Vivoactive 3 Review | 37 |
| Polar M400 v1.4 | 4.4 | 5.7 | 3.4 | 6.5 | U-blox | Unknown | Polar M400 Review | 38 |
| Epson SF-510 | 4.3 | 6.1 | 3.0 | 5.4 | Epson | Unknown | Epson SF-810 Review | 39 |
The values used are simply 10 minus the value for trueness and standard deviation. The overall is 10 minus the standard deviation from true values.
Contents
1 Methodology
Main article: GPS Testing Methodology
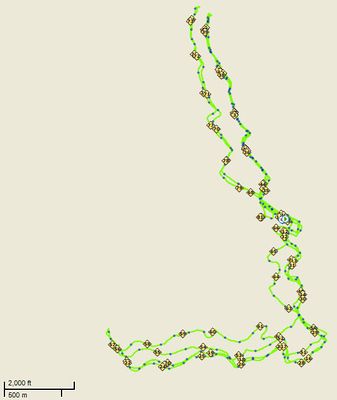
Simply taking a GPS watch on a single run does not provide sufficient data to reasonably evaluate its accuracy. To gather the data for this test I ran the same route repeatedly, recording laps every quarter mile. The course is challenging for GPS, with lots of twists, tree cover, power lines, turn arounds and goes under a bridge. However, I believe that it's reasonably representative of real-world conditions, and probably less challenging than running in the city with skyscrapers.
2 Accuracy, Trueness and Precision
For this evaluation I'll use the ISO 5725 definition of Accuracy as the combination of trueness and precision.
We can look at trueness by measuring the average lap length and precision by measuring the standard deviation. I use the traditional approach to standard deviation (variation from mean) as well as a modified approach that uses variation from the true value. (It is more common in many fields to use "accuracy" to mean closeness to true value and "validity" to mean the combination of accuracy and precision. However, I feel that the meanings used by ISO 5725 are closer to the common usage. If a company sold 'accurate' 12 inch pipes and shipped half of them as 6 inches and half as 18 inches, they would meet the traditional definition of accuracy, but few people would be happy with the product. )
3 Accuracy
The table below shows summary data for each device. The count field is how many measurements I have for that combination of condition and device, with each measurement being a quarter mile distance. I generally aim for over 1,000 data points to even out the effects of weather, satellite position and other factors. The Trueness is the absolute of the mean, though nearly all watches tend to read short. The standard deviation is provided based on the variance from the mean and the variance from the known true value. The average pace error is shown to give a sense of how much error you're likely to see in the display of current pace. This is an average error not a worst case. The data shown below is a summary the accuracy based on all the sections. If you'd like more detailed information, I've split off the Detailed Statistics for GPS Running Watches for the results under different conditions.
| Device | Count | Accuracy (Combined) |
Trueness (Average Distance Error) |
Precision (From mean) |
Precision (From true) |
Repeatability | Pace Error (95%) | Distance Error | ||
|---|---|---|---|---|---|---|---|---|---|---|
| (from 9:00 min/mile) | (from 5:30 min/Km) | (20 miles) | (30 Km) | |||||||
| Stryd Footpod (uncalibrated) | 321 | 0.62% (32.8 Ft/Mile, 6.2 m/Km) | 0.29% (15.2 Ft/Mile, 2.9 m/Km) | 0.77% (40.8 Ft/Mile, 7.7 m/Km) | 0.83% (43.8 Ft/Mile, 8.3 m/Km) | 0.73% (38.6 Ft/Mile, 7.3 m/Km) | 0:09 | 0:05 | 0.06 | 0.09 |
| Adidas Speed Cell FP (calibrated) | 361 | 1.43% (75.7 Ft/Mile, 14.3 m/Km) | 0.34% (17.9 Ft/Mile, 3.4 m/Km) | 1.97% (103.9 Ft/Mile, 19.7 m/Km) | 2.00% (105.6 Ft/Mile, 20.0 m/Km) | 1.78% (94.2 Ft/Mile, 17.8 m/Km) | 0:22 | 0:13 | 0.07 | 0.10 |
| Garmin Footpod (calibrated) | 3667 | 1.75% (92.6 Ft/Mile, 17.5 m/Km) | 0.28% (14.7 Ft/Mile, 2.8 m/Km) | 2.45% (129.3 Ft/Mile, 24.5 m/Km) | 2.47% (130.2 Ft/Mile, 24.7 m/Km) | 2.38% (125.6 Ft/Mile, 23.8 m/Km) | 0:27 | 0:16 | 0.06 | 0.08 |
| MilestonePod Footpod (calibrated) | 439 | 1.86% (98.1 Ft/Mile, 18.6 m/Km)** | 0.19% (10.1 Ft/Mile, 1.9 m/Km) | 2.61% (138.0 Ft/Mile, 26.1 m/Km) | 2.62% (138.4 Ft/Mile, 26.2 m/Km) | 2.33% (123.2 Ft/Mile, 23.3 m/Km) | 0:28 | 0:17 | 0.04 | 0.06 |
| Polar V800 | 1986 | 1.87% (98.8 Ft/Mile, 18.7 m/Km)***** | 0.29% (15.2 Ft/Mile, 2.9 m/Km) | 2.61% (138.0 Ft/Mile, 26.1 m/Km) | 2.63% (138.8 Ft/Mile, 26.3 m/Km) | 1.94% (102.4 Ft/Mile, 19.4 m/Km) | 0:28 | 0:17 | 0.06 | 0.09 |
| Suunto Ambit3 Run | 1261 | 2.08% (110.1 Ft/Mile, 20.8 m/Km)***** | 0.44% (23.2 Ft/Mile, 4.4 m/Km) | 2.88% (152.1 Ft/Mile, 28.8 m/Km) | 2.92% (153.9 Ft/Mile, 29.2 m/Km) | 2.17% (114.8 Ft/Mile, 21.7 m/Km) | 0:31 | 0:19 | 0.09 | 0.13 |
| iPhone 5s | 513 | 2.09% (110.4 Ft/Mile, 20.9 m/Km) | 0.30% (15.8 Ft/Mile, 3.0 m/Km) | 2.93% (154.5 Ft/Mile, 29.3 m/Km) | 2.94% (155.3 Ft/Mile, 29.4 m/Km) | 2.35% (124.2 Ft/Mile, 23.5 m/Km) | 0:32 | 0:19 | 0.06 | 0.09 |
| Suunto Spartan Trainer 1.10.28 | 590 | 2.17% (114.8 Ft/Mile, 21.7 m/Km)***** | 1.25% (65.8 Ft/Mile, 12.5 m/Km) | 2.50% (132.0 Ft/Mile, 25.0 m/Km) | 2.81% (148.4 Ft/Mile, 28.1 m/Km) | 1.99% (105.3 Ft/Mile, 19.9 m/Km) | 0:30 | 0:19 | 0.25 | 0.37 |
| Polar Stride Sensor Footpod (calibrated) | 309 | 2.33% (123.2 Ft/Mile, 23.3 m/Km)***** | 1.46% (77.1 Ft/Mile, 14.6 m/Km) | 2.53% (133.4 Ft/Mile, 25.3 m/Km) | 2.96% (156.2 Ft/Mile, 29.6 m/Km) | 2.05% (108.1 Ft/Mile, 20.5 m/Km) | 0:32 | 0:20 | 0.29 | 0.44 |
| Garmin 205 | 1155 | 2.36% (124.4 Ft/Mile, 23.6 m/Km)***** | 0.34% (17.7 Ft/Mile, 3.4 m/Km) | 3.30% (174.1 Ft/Mile, 33.0 m/Km) | 3.32% (175.1 Ft/Mile, 33.2 m/Km) | 2.97% (156.9 Ft/Mile, 29.7 m/Km) | 0:36 | 0:22 | 0.07 | 0.10 |
| Suunto Ambit2 R | 1025 | 2.41% (127.4 Ft/Mile, 24.1 m/Km)***** | 1.49% (78.8 Ft/Mile, 14.9 m/Km) | 2.67% (140.9 Ft/Mile, 26.7 m/Km) | 3.07% (162.0 Ft/Mile, 30.7 m/Km) | 2.22% (117.5 Ft/Mile, 22.2 m/Km) | 0:33 | 0:20 | 0.30 | 0.45 |
| Garmin 910XT | 701 | 2.46% (129.9 Ft/Mile, 24.6 m/Km)***** | 1.22% (64.3 Ft/Mile, 12.2 m/Km) | 3.01% (158.9 Ft/Mile, 30.1 m/Km) | 3.26% (172.1 Ft/Mile, 32.6 m/Km) | 2.40% (126.5 Ft/Mile, 24.0 m/Km) | 0:35 | 0:22 | 0.24 | 0.37 |
| iPhone 4s | 945 | 2.51% (132.4 Ft/Mile, 25.1 m/Km)***** | 1.01% (53.6 Ft/Mile, 10.1 m/Km) | 3.24% (171.0 Ft/Mile, 32.4 m/Km) | 3.40% (179.5 Ft/Mile, 34.0 m/Km) | 2.83% (149.2 Ft/Mile, 28.3 m/Km) | 0:37 | 0:22 | 0.20 | 0.30 |
| Garmin 310XT | 4801 | 2.69% (142.2 Ft/Mile, 26.9 m/Km)***** | 0.61% (32.0 Ft/Mile, 6.1 m/Km) | 3.71% (195.9 Ft/Mile, 37.1 m/Km) | 3.76% (198.5 Ft/Mile, 37.6 m/Km) | 3.35% (176.9 Ft/Mile, 33.5 m/Km) | 0:41 | 0:25 | 0.12 | 0.18 |
| Leikr | 650 | 2.71% (143.3 Ft/Mile, 27.1 m/Km)***** | 1.12% (59.1 Ft/Mile, 11.2 m/Km) | 3.49% (184.2 Ft/Mile, 34.9 m/Km) | 3.67% (193.9 Ft/Mile, 36.7 m/Km) | 2.84% (150.1 Ft/Mile, 28.4 m/Km) | 0:40 | 0:24 | 0.22 | 0.34 |
| Garmin 610 | 997 | 2.75% (145.1 Ft/Mile, 27.5 m/Km)***** | 1.66% (87.5 Ft/Mile, 16.6 m/Km) | 3.08% (162.8 Ft/Mile, 30.8 m/Km) | 3.51% (185.6 Ft/Mile, 35.1 m/Km) | 2.29% (121.0 Ft/Mile, 22.9 m/Km) | 0:38 | 0:23 | 0.33 | 0.50 |
| Polar M430 1.0.28 | 589 | 2.85% (150.4 Ft/Mile, 28.5 m/Km)***** | 1.06% (56.0 Ft/Mile, 10.6 m/Km) | 3.73% (196.7 Ft/Mile, 37.3 m/Km) | 3.88% (205.1 Ft/Mile, 38.8 m/Km) | 2.81% (148.4 Ft/Mile, 28.1 m/Km) | 0:42 | 0:26 | 0.21 | 0.32 |
| Suunto Spartan Ultra | 379 | 2.86% (150.9 Ft/Mile, 28.6 m/Km)** | 0.50% (26.3 Ft/Mile, 5.0 m/Km) | 3.98% (210.0 Ft/Mile, 39.8 m/Km) | 4.01% (211.8 Ft/Mile, 40.1 m/Km) | 2.63% (138.8 Ft/Mile, 26.3 m/Km) | 0:43 | 0:26 | 0.10 | 0.15 |
| Garmin 620 | 1039 | 2.93% (154.7 Ft/Mile, 29.3 m/Km)***** | 1.75% (92.5 Ft/Mile, 17.5 m/Km) | 3.30% (174.4 Ft/Mile, 33.0 m/Km) | 3.76% (198.3 Ft/Mile, 37.6 m/Km) | 2.79% (147.3 Ft/Mile, 27.9 m/Km) | 0:41 | 0:25 | 0.35 | 0.53 |
| Apple Watch 3 iSmoothRun | 308 | 2.97% (156.8 Ft/Mile, 29.7 m/Km)** | 1.09% (57.8 Ft/Mile, 10.9 m/Km) | 3.88% (205.1 Ft/Mile, 38.8 m/Km) | 4.05% (214.0 Ft/Mile, 40.5 m/Km) | 3.03% (160.0 Ft/Mile, 30.3 m/Km) | 0:44 | 0:27 | 0.22 | 0.33 |
| Samsung Galaxy S3 | 845 | 3.19% (168.4 Ft/Mile, 31.9 m/Km)***** | 1.38% (72.8 Ft/Mile, 13.8 m/Km) | 4.05% (214.0 Ft/Mile, 40.5 m/Km) | 4.29% (226.7 Ft/Mile, 42.9 m/Km) | 3.02% (159.2 Ft/Mile, 30.2 m/Km) | 0:46 | 0:28 | 0.28 | 0.41 |
| Polar M400 v1.9.600 | 384 | 3.38% (178.5 Ft/Mile, 33.8 m/Km)***** | 1.79% (94.5 Ft/Mile, 17.9 m/Km) | 4.02% (212.2 Ft/Mile, 40.2 m/Km) | 4.43% (234.0 Ft/Mile, 44.3 m/Km) | 2.91% (153.5 Ft/Mile, 29.1 m/Km) | 0:48 | 0:29 | 0.36 | 0.54 |
| Garmin 920XT | 858 | 3.39% (179.1 Ft/Mile, 33.9 m/Km)***** | 2.51% (132.4 Ft/Mile, 25.1 m/Km) | 3.19% (168.4 Ft/Mile, 31.9 m/Km) | 4.09% (216.0 Ft/Mile, 40.9 m/Km) | 2.48% (131.1 Ft/Mile, 24.8 m/Km) | 0:44 | 0:27 | 0.50 | 0.75 |
| TomTom Cardio Runner | 759 | 3.44% (181.7 Ft/Mile, 34.4 m/Km)***** | 2.36% (124.8 Ft/Mile, 23.6 m/Km) | 3.50% (185.0 Ft/Mile, 35.0 m/Km) | 4.25% (224.6 Ft/Mile, 42.5 m/Km) | 2.54% (134.0 Ft/Mile, 25.4 m/Km) | 0:46 | 0:28 | 0.47 | 0.71 |
| Garmin 225 | 855 | 3.75% (198.1 Ft/Mile, 37.5 m/Km)***** | 2.67% (141.1 Ft/Mile, 26.7 m/Km) | 3.68% (194.4 Ft/Mile, 36.8 m/Km) | 4.58% (242.0 Ft/Mile, 45.8 m/Km) | 2.87% (151.7 Ft/Mile, 28.7 m/Km) | 0:49 | 0:30 | 0.53 | 0.80 |
| Garmin Fenix 3 | 1019 | 3.75% (198.1 Ft/Mile, 37.5 m/Km)***** | 2.44% (129.1 Ft/Mile, 24.4 m/Km) | 4.00% (211.3 Ft/Mile, 40.0 m/Km) | 4.71% (248.7 Ft/Mile, 47.1 m/Km) | 3.21% (169.5 Ft/Mile, 32.1 m/Km) | 0:51 | 0:31 | 0.49 | 0.73 |
| Polar RC3 GPS | 1104 | 3.95% (208.5 Ft/Mile, 39.5 m/Km)***** | 1.78% (93.9 Ft/Mile, 17.8 m/Km) | 4.98% (262.7 Ft/Mile, 49.8 m/Km) | 5.29% (279.5 Ft/Mile, 52.9 m/Km) | 4.07% (214.8 Ft/Mile, 40.7 m/Km) | 0:57 | 0:35 | 0.36 | 0.53 |
| Garmin Fenix 2 | 1044 | 4.34% (229.3 Ft/Mile, 43.4 m/Km)***** | 2.77% (146.0 Ft/Mile, 27.7 m/Km) | 4.70% (248.3 Ft/Mile, 47.0 m/Km) | 5.48% (289.5 Ft/Mile, 54.8 m/Km) | 2.84% (150.1 Ft/Mile, 28.4 m/Km) | 0:59 | 0:36 | 0.55 | 0.83 |
| Fenix 5X 4.30 | 310 | 4.44% (234.5 Ft/Mile, 44.4 m/Km)***** | 3.12% (164.6 Ft/Mile, 31.2 m/Km) | 4.33% (228.7 Ft/Mile, 43.3 m/Km) | 5.45% (287.9 Ft/Mile, 54.5 m/Km) | 3.24% (171.1 Ft/Mile, 32.4 m/Km) | 0:59 | 0:36 | 0.62 | 0.94 |
| Garmin 935 | 345 | 4.45% (234.7 Ft/Mile, 44.5 m/Km)***** | 3.23% (170.7 Ft/Mile, 32.3 m/Km) | 4.19% (221.1 Ft/Mile, 41.9 m/Km) | 5.39% (284.7 Ft/Mile, 53.9 m/Km) | 2.84% (150.1 Ft/Mile, 28.4 m/Km) | 0:58 | 0:36 | 0.65 | 0.97 |
| Epson SF-810 | 627 | 4.57% (241.1 Ft/Mile, 45.7 m/Km)***** | 2.72% (143.7 Ft/Mile, 27.2 m/Km) | 5.14% (271.4 Ft/Mile, 51.4 m/Km) | 5.86% (309.3 Ft/Mile, 58.6 m/Km) | 4.27% (225.5 Ft/Mile, 42.7 m/Km) | 1:03 | 0:39 | 0.54 | 0.82 |
| Garmin Epix | 592 | 4.59% (242.5 Ft/Mile, 45.9 m/Km)***** | 3.24% (171.1 Ft/Mile, 32.4 m/Km) | 4.54% (239.6 Ft/Mile, 45.4 m/Km) | 5.63% (297.3 Ft/Mile, 56.3 m/Km) | 3.23% (170.3 Ft/Mile, 32.3 m/Km) | 1:01 | 0:37 | 0.65 | 0.97 |
| Garmin 10 | 1050 | 4.95% (261.2 Ft/Mile, 49.5 m/Km)***** | 3.80% (200.7 Ft/Mile, 38.0 m/Km) | 4.43% (233.8 Ft/Mile, 44.3 m/Km) | 5.87% (310.2 Ft/Mile, 58.7 m/Km) | 3.15% (166.3 Ft/Mile, 31.5 m/Km) | 1:03 | 0:39 | 0.76 | 1.14 |
| Garmin Vivoactive | 598 | 4.96% (262.1 Ft/Mile, 49.6 m/Km)***** | 3.78% (199.4 Ft/Mile, 37.8 m/Km) | 4.46% (235.2 Ft/Mile, 44.6 m/Km) | 5.92% (312.5 Ft/Mile, 59.2 m/Km) | 3.44% (181.7 Ft/Mile, 34.4 m/Km) | 1:04 | 0:39 | 0.76 | 1.13 |
| Garmin 235 | 899 | 5.08% (268.1 Ft/Mile, 50.8 m/Km)***** | 3.93% (207.3 Ft/Mile, 39.3 m/Km) | 4.49% (236.9 Ft/Mile, 44.9 m/Km) | 6.01% (317.4 Ft/Mile, 60.1 m/Km) | 3.59% (189.3 Ft/Mile, 35.9 m/Km) | 1:05 | 0:40 | 0.79 | 1.18 |
| Garmin VivoactiveHR | 929 | 5.10% (269.5 Ft/Mile, 51.0 m/Km)***** | 4.02% (212.5 Ft/Mile, 40.2 m/Km) | 4.37% (230.8 Ft/Mile, 43.7 m/Km) | 5.99% (316.3 Ft/Mile, 59.9 m/Km) | 3.05% (161.1 Ft/Mile, 30.5 m/Km) | 1:05 | 0:40 | 0.80 | 1.21 |
| Garmin Vivoactive 3 | 445 | 5.52% (291.5 Ft/Mile, 55.2 m/Km)***** | 4.25% (224.3 Ft/Mile, 42.5 m/Km) | 4.85% (256.3 Ft/Mile, 48.5 m/Km) | 6.55% (345.9 Ft/Mile, 65.5 m/Km) | 3.54% (186.9 Ft/Mile, 35.4 m/Km) | 1:11 | 0:43 | 0.85 | 1.27 |
| Polar M400 v1.4 | 1367 | 5.56% (293.7 Ft/Mile, 55.6 m/Km)***** | 4.28% (226.1 Ft/Mile, 42.8 m/Km) | 4.98% (262.8 Ft/Mile, 49.8 m/Km) | 6.60% (348.5 Ft/Mile, 66.0 m/Km) | 3.46% (182.8 Ft/Mile, 34.6 m/Km) | 1:11 | 0:44 | 0.86 | 1.28 |
| Epson SF-510 | 539 | 5.67% (299.5 Ft/Mile, 56.7 m/Km)***** | 3.94% (207.9 Ft/Mile, 39.4 m/Km) | 5.69% (300.4 Ft/Mile, 56.9 m/Km) | 6.99% (369.0 Ft/Mile, 69.9 m/Km) | 4.60% (243.0 Ft/Mile, 46.0 m/Km) | 1:15 | 0:46 | 0.79 | 1.18 |
3.1 Progress of newer watches
I expected GPS watches to improve with time, but the opposite appears to be happening. With the Garmin devices especially, you can see that the older watches generally do far better than the newer ones. I suspect this is due to compromises to get better battery life and smaller packaging and the cost of GPS accuracy.
3.2 Interpretation and Conclusions
What do these statistics mean? This is my interpretation:
- Under normal conditions the GPS accuracy is quite good for most devices.
- The accuracy of a calibrated Footpod is far better than any GPS device. Without calibration the Footpod is more accurate than any watch currently on the market with the exception of the 310XT/910XT with a Footpod backing up the GPS.
- The Polar M400, Garmin Fenix 2, and Garmin 10 are noticeably poorer than the other devices. I found the accuracy of the M400/Fenix2/10 in general usage to be rather grim, and I did some testing pairing them up with the 610 or the 310XT. In all cases the Fenix2/10 would have poor accuracy compared with the 610 or 310XT on the same run.
- The Fenix2 would repeated loose satellite reception, something I've not seen (the M400 has done this once). The statistics do not reflect just how bad the Fenix2 is, as some of the data is too bad to analyze.
- The results of the Garmin 610 & 620 indicate the problems with the 10 are not inherent in a smaller device.
- The improvement in GPS accuracy of the 620 with updated firmware shows just how important the software can be. With the earlier firmware the 620 lost over a mile over a 20 mile run!
- The accuracy of all devices is better in a straight line than on curves or twisty routes. My course is a tough test for GPS devices with many curves and only a few relatively straight sections.
- Not surprisingly, for many devices accuracy drops going under the bridge. However, some devices do great in this section, probably because it's fairly straight.
- More interestingly the trueness just after the bridge is even lower, suggesting that the GPS watches are struggling to reacquire the satellites.
- The turnarounds are even less accurate than going under a bridge, but Power Lines do not seem to impact accuracy noticeably.
- The Footpod improves the accuracy of the 310XT.
- Note that I'm intentionally using an uncalibrated Footpod (factor = 1.000) to gather data for a comparison of Foodpod and GPS.
- The older Garmin 205 does remarkably well.
4 Recommendations
Here are some recommendations for GPS watches.
- Most GPS watches are accurate enough for casual running. However, the M400, Fenix2, and 10 have such serious problems that I would not recommend them even for casual usage.
- The better devices are accurate enough for most runners if their limitations are understood.
- None of the devices were accurate enough for a runner to trust the display of current pace for training or race pacing.
- For interval training, use a track or measure out the distance using some other mechanism.
- For general training or for races, use a device that supports displaying pace from the Footpod while using GPS for distance.
- Adding a Footpod to the Garmin 310XT improves its GPS accuracy.
- For the Garmin 610 there was no difference with and without the Footpod. (Trueness was 3.33%/3.32%, Precision was 3.54%/3.68%, with/without).
- It takes time for the GPS watches to acquire the satellites. Some watches tended to say they are ready to go before they have an optimal lock. Therefore, to improve accuracy try to give them a little more time. Note that some newer GPS watches such as the Garmin 620 have the ability to be preloaded with the satellite positions, reducing this startup time and start up inaccuracy dramatically.
5 Footpod Accuracy
The accuracy of a Footpod is far higher than GPS, as well as more consistent and quicker to react to changes in pace. For any given run, the average pace error from the Footpod is only 7 seconds/mile (at a 9:00 min/mile pace) or 5 seconds/Km (at a 5:30 min/Km pace). In practical terms, I've found that I always have to use a Footpod to pace a marathon or for critical speedwork. For details of how the Footpod calibration was done, see GPS Testing Methodology.
6 Even GPS Watches have Bad Days
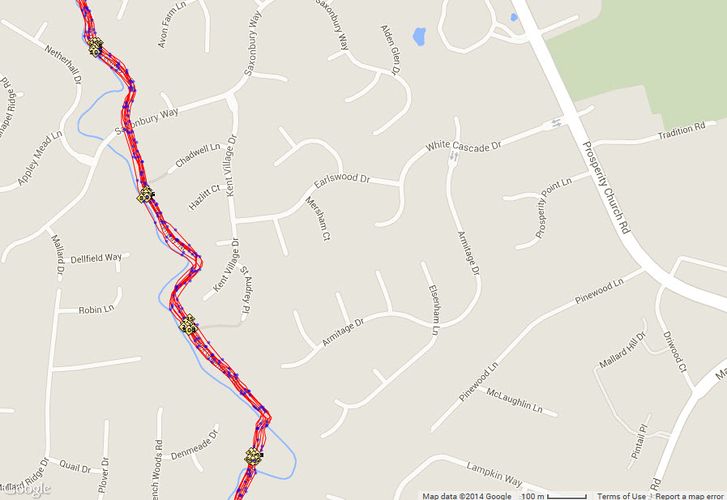
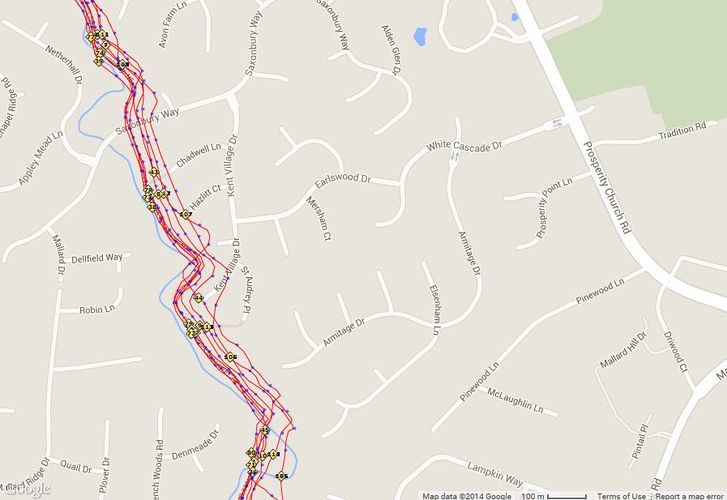
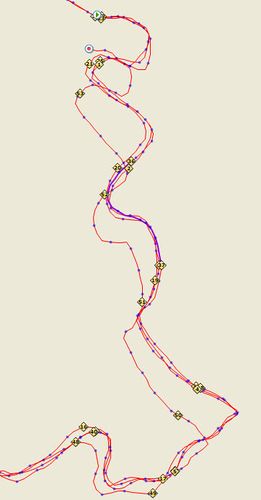
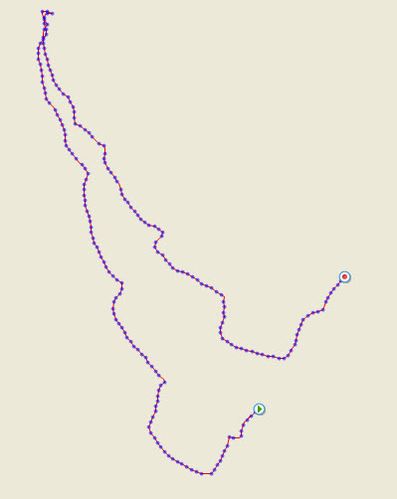
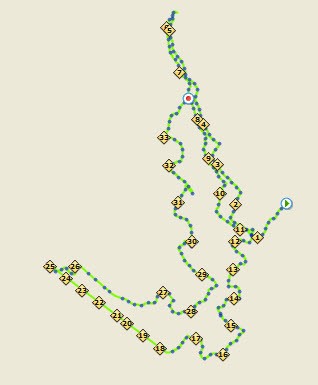
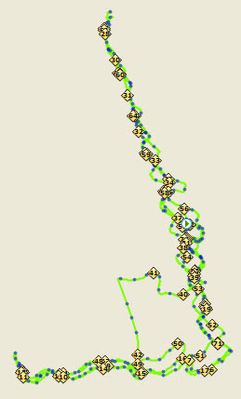
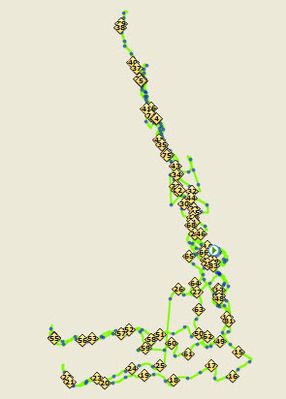
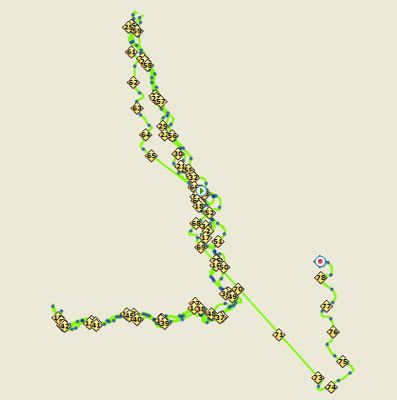
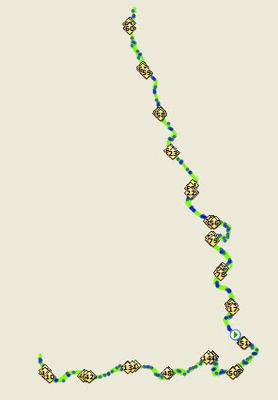
While it's tempting to take the various GPS watches on a single run and simply compare the totals, this is a flawed approach. Evaluating the devices GPS accuracy on the basis of a single sample does not tell you much. It's a bit like evaluating an athlete's ability on the basis of one event; everyone has good days and bad days, and that applies to GPS watches as well. To illustrate this, the images below are from two runs, recorded on 9/20 and 9/22. In each run I recorded data on both the 310 and 910 watches, hitting the lap button on both at as close to the same time as is humanly possible. On 9/20 the 910XT was far more accurate than the 310XT, but on 9/22 the situation is reversed. If you were to have evaluated the two watches on the basis of a single run, you would conclude that one is much better than the other. But which device would win would depend on the particular day. This is why I've accumulated a lot of data to do a statistical analysis to work out which is really better.
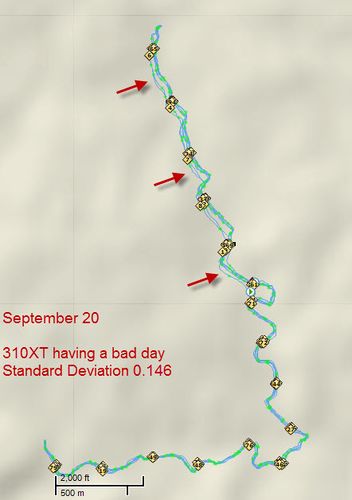 The Garmin 310XT having a bad day. You can see on the upper half of the course where it got a little confused and off track. |
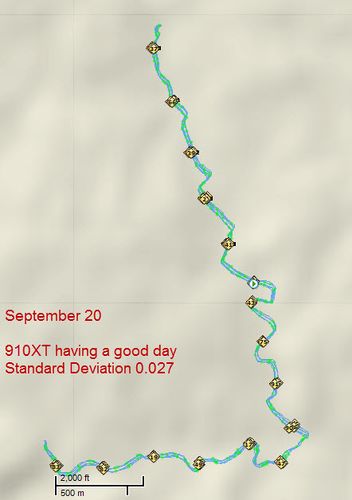 The Garmin 910XT on the same run having no problems, and only the standard, expected level of inaccuracy. |
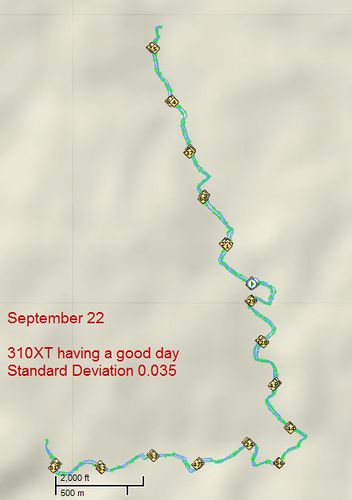 Two days later and it's the turn of the Garmin 310XT to have a good day. |
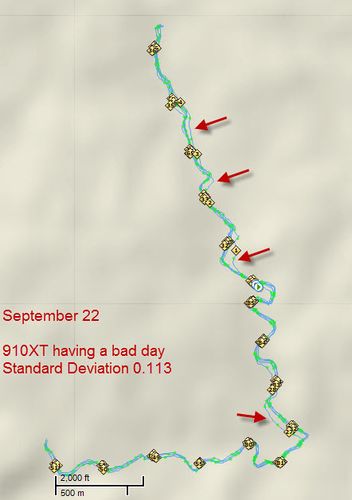 Again, this track is recorded on the same run as the image to the left. The Garmin 910XT gets a little confused at the start, and then again around lap 27. |
7 Some Devices Are Better Than Others
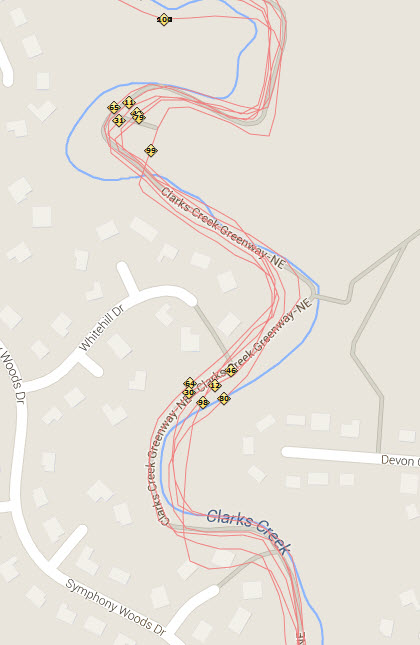
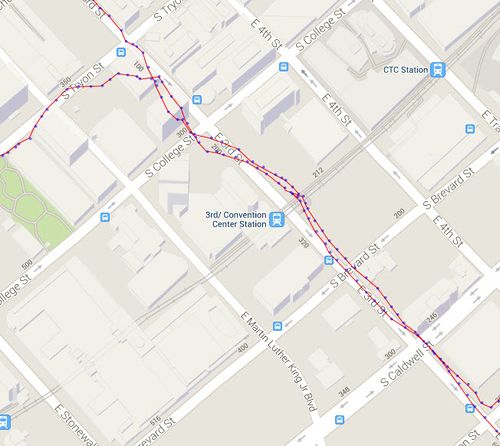
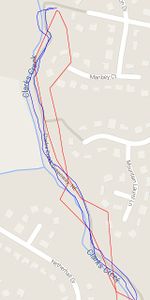
Below is a section of two runs showing the same section of the course, both taken at the same time, one from the Garmin 310XT and the other from the Garmin 620 with the early firmware. (With the later firmware the tracks from the 620 look like the 310XT.)
8 GPS Short and long measurements
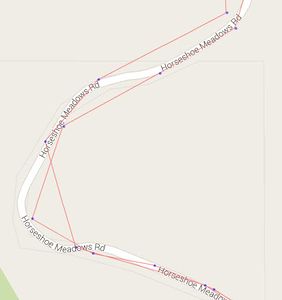
As you can see from the images below, the GPS track tends to take shortcuts around bends, reducing the length of the measured track. This cutting of the corners indicates the devices are doing some post-hoc smoothing to try to overcome the GPS errors. The more smoothing they do, the better the accuracy is likely to be in a straight line and the worse it is around corners or twisty courses. In my discussions with engineers working on GPS systems, this type of smoothing is often performed with a Kalman filter. (When I tested using software without smoothing I found the measurements were long on my course rather than short, which is almost always the case.)
Often GPS measurements of races, especially marathons record a longer distance than the race. This is partly because the USATF technique for measuring the distance takes a path that is no more than 12 inches away from the tangent (corner), and few runners are able to run that close. In a large marathon you can be forced to take a line that is a long way from the tangent. The other factor is that on a straight line, the GPS error tends to give a slightly longer measurement.
9 Garmin 620 Issues
The Garmin 620 had some notorious problems with its GPS accuracy. The table below shows the changes with various firmware versions, culminating in the GPS-3.30 firmware that resolved the issues. I've including some testing I did without EPO data (NoEPO row below) and with a Footpod (+FP row below).
| Device | Count | Accuracy (Combined) |
Trueness (Average Distance Error) |
Standard Deviation (From mean) |
Standard Deviation (From true) |
Pace Error (95%) | Distance Error | ||
|---|---|---|---|---|---|---|---|---|---|
| Garmin 620 (original v2.80) | 412 | 3.24% (171.0 Ft/Mile, 32.4 m/Km) | 1.95% (103.0 Ft/Mile, 19.5 m/Km) | 3.65% (192.9 Ft/Mile, 36.5 m/Km) | 4.14% (218.7 Ft/Mile, 41.4 m/Km) | 0:45 | 0:27 | 0.39 | 0.59 |
| Garmin 620 (replacement v2.90) | 395 | 6.65% (351.1 Ft/Mile, 66.5 m/Km) | 5.13% (270.8 Ft/Mile, 51.3 m/Km) | 5.98% (315.7 Ft/Mile, 59.8 m/Km) | 7.88% (416.2 Ft/Mile, 78.8 m/Km) | 1:25 | 0:52 | 1.03 | 1.54 |
| Garmin 620 (replacement v3.00) | 322 | 6.24% (329.3 Ft/Mile, 62.4 m/Km) | 4.62% (243.7 Ft/Mile, 46.2 m/Km) | 5.92% (312.8 Ft/Mile, 59.2 m/Km) | 7.51% (396.8 Ft/Mile, 75.1 m/Km) | 1:21 | 0:50 | 0.92 | 1.38 |
| Garmin 620 (replacement v3.00, NoEPO) | 307 | 4.06% (214.5 Ft/Mile, 40.6 m/Km) | 2.48% (131.2 Ft/Mile, 24.8 m/Km) | 4.54% (239.8 Ft/Mile, 45.4 m/Km) | 5.18% (273.5 Ft/Mile, 51.8 m/Km) | 0:56 | 0:34 | 0.50 | 0.75 |
| Garmin 620 (replacement v3.00, +FP) | 546 | 5.04% (265.9 Ft/Mile, 50.4 m/Km) | 2.67% (140.8 Ft/Mile, 26.7 m/Km) | 6.04% (319.0 Ft/Mile, 60.4 m/Km) | 6.60% (348.7 Ft/Mile, 66.0 m/Km) | 1:11 | 0:44 | 0.53 | 0.80 |
| Garmin 620 (replacement v3.00, GPS 3.30) | 1039 | 2.75% (145.2 Ft/Mile, 27.5 m/Km) | 1.58% (83.3 Ft/Mile, 15.8 m/Km) | 3.18% (168.1 Ft/Mile, 31.8 m/Km) | 3.55% (187.7 Ft/Mile, 35.5 m/Km) | 0:38 | 0:23 | 0.32 | 0.47 |
10 Garmin Fenix 2 Issues
Like the Garmin 620, I've had similar GPS accuracy issues with the Fenix 2. In fact, the Fenix 2 is the only device I've ever had that has given the "lost satellite reception" message on my usual running route. Because of these issues Garmin replaced my Fenix 2 under warranty, and below are the results for the original and new watches. The replacement watch also gave "lost satellite reception" repeatedly and the error values for the Fenix 2 do not reflect these problems as the data from those runs was useless for analysis. I suspect there are three (possibly related) problems with the Fenix 2:
- The MediaTek GPS chipset is not as accurate as the SiRF chipset. The best results from the Fenix 2 are generally mediocre.
- The Fenix 2 records the right shape track, but offset by some distance. This does not look like a typical accuracy problem that would manifest itself randomly.
- Occasionally the Fenix 2 will report "lost satellite reception", and I have several instances of this where the date and time were wrong after reception was lost. If a GPS device has the wrong time, then it will expect the satellites to be in different positions and will be unable to acquire a position fix. I have four instances where the workout file was stored with a date in April 2019, indicating that was the date when I terminated the workout and attempted to reacquire satellite lock. In one case I noticed the date and time was set incorrectly on the watch display after the satellite lost message. There are also reports from various users about lost satellite reception and the 2019 date. This problem might also explain the offset track above, but only if the clock was out by a very small amount.
| Device | Count | Accuracy (Combined) |
Trueness (Average Distance Error) |
Standard Deviation (From mean) |
Standard Deviation (From true) |
Pace Error (95%) | Distance Error | ||
|---|---|---|---|---|---|---|---|---|---|
| Garmin Fenix 2 original 2.50 | 1396 | 4.50% (237.6 Ft/Mile, 45.0 m/Km) | 1.59% (84.1 Ft/Mile, 15.9 m/Km) | 5.95% (314.3 Ft/Mile, 59.5 m/Km) | 6.16% (325.3 Ft/Mile, 61.6 m/Km) | 1:07 | 0:41 | 0.32 | 0.48 |
| Garmin Fenix 2 replacement 3.10 | 400 | 4.91% (259.4 Ft/Mile, 49.1 m/Km) | 3.17% (167.3 Ft/Mile, 31.7 m/Km) | 5.31% (280.2 Ft/Mile, 53.1 m/Km) | 6.18% (326.5 Ft/Mile, 61.8 m/Km) | 1:07 | 0:41 | 0.63 | 0.95 |
| Garmin Fenix 2 replacement 3.20 | 570 | 5.06% (267.3 Ft/Mile, 50.6 m/Km) | 3.19% (168.3 Ft/Mile, 31.9 m/Km) | 5.56% (293.6 Ft/Mile, 55.6 m/Km) | 6.41% (338.5 Ft/Mile, 64.1 m/Km) | 1:09 | 0:42 | 0.64 | 0.96 |
| Garmin Fenix 2 replacement 3.20 (No WAAS) | 866 | 5.50% (290.6 Ft/Mile, 55.0 m/Km) | 3.10% (163.5 Ft/Mile, 31.0 m/Km) | 6.44% (339.8 Ft/Mile, 64.4 m/Km) | 7.14% (377.1 Ft/Mile, 71.4 m/Km) | 1:17 | 0:47 | 0.62 | 0.93 |
| Garmin Fenix 2 replacement 3.70 (+FP) | 720 | 5.91% (312.2 Ft/Mile, 59.1 m/Km) | 3.49% (184.1 Ft/Mile, 34.9 m/Km) | 6.75% (356.5 Ft/Mile, 67.5 m/Km) | 7.60% (401.2 Ft/Mile, 76.0 m/Km) | 1:22 | 0:50 | 0.70 | 1.05 |
| Garmin Fenix 2 replacement (Hotstart) | 213 | 4.47% (236.1 Ft/Mile, 44.7 m/Km) | 2.61% (137.7 Ft/Mile, 26.1 m/Km) | 5.13% (271.1 Ft/Mile, 51.3 m/Km) | 5.76% (304.2 Ft/Mile, 57.6 m/Km) | 1:02 | 0:38 | 0.52 | 0.78 |
| Garmin Fenix 2 replacement 4.00, GPS 3.30 | 1044 | 4.09% (215.8 Ft/Mile, 40.9 m/Km) | 2.59% (136.6 Ft/Mile, 25.9 m/Km) | 4.47% (236.3 Ft/Mile, 44.7 m/Km) | 5.17% (273.0 Ft/Mile, 51.7 m/Km) | 0:56 | 0:34 | 0.52 | 0.78 |
11 Polar V800 GPS Accuracy
As you can see from the numbers above, the V800 is remarkably accurate. The V800 uses the latest SiRF chipset, rather than the MediaTek chipset that has caused so many problems in the Garmin 620 and Garmin Fenix 2. This SiRF chipset includes satellite prediction to reduce the time it takes to acquire the first satellite lock. This generally works pretty well, but is not as fast as the MediaTek chipset.
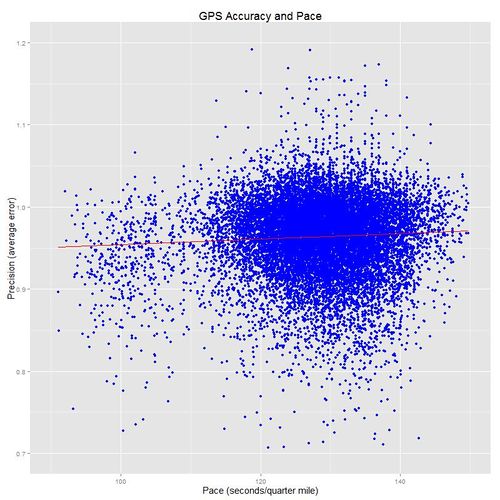
12 GPS Accuracy and Pace
There have been reports of GPS accuracy changing with pace, but as you can see from the graph above, my testing does not show this.
13 GPS Accuracy and Sampling Rate
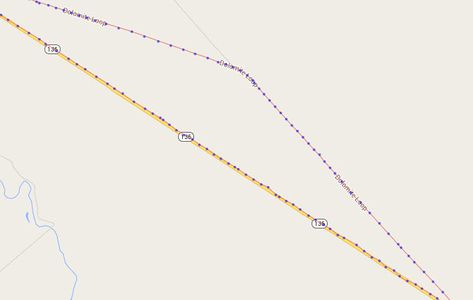
GPS watches default to recording a sample frequently enough that accuracy is not compromised. However, several devices offer the option of recording less frequently to improve battery life at the cost of accuracy. These devices actually turn off the GPS receiver, turning it on periodically for just long enough to get a fix. The images below are from the 2014 Badwater 135 using the Suunto Ambit2 R with recording set to one minute intervals. As you can see, accuracy suffers on curves, but is fine on the straights. For a course like Badwater, the one minute recording interval was fine as the course has few turns.
14 Device Specific Notes
For those interested in some of the details of how devices are configured for testing, here are some additional notes.
- Garmin devices are set to 'smart recording'. I did try an informal test with the 620 using 1-second recording, but it appeared to make no difference.
- For details of the calibration of the Footpod see GPS Testing Methodology.
- The Fenix 2 was tested with and without WAAS support activated; WAAS helped slightly.
15 Next Steps
This is an initial analysis of the data I have, and there are a number of further evaluations to do.
- Check how GPS accuracy changes over the course of a run, as I've seen a distinct tendency for the watches to say they are good to go when they don't really have an optimal lock on the satellites. I wait for 5+ minutes between the watches saying they have sufficient satellites locked in, so this should not be a problem with the data shown here, but I could do some tests where I turn on the watch from a cold state, then start running as soon as they claim they have a lock.
- Look at how accurate the GPS watches are for measuring elevation, and compare with barometric data.
- Write up general GPS accuracy.
