Optical Heart Rate Monitoring
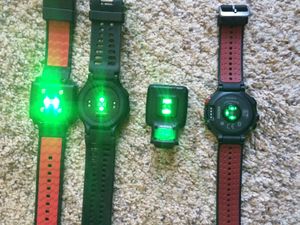
Optical Heart Rate Monitoring detects the blood filling the capillaries under your skin as your heart beats. Each time your heart beats the capillaries expand with blood, and this ebb and flow can be used to determine your heart rate. Most optical heart rate monitors for use while exercising shine a green light into the skin and use a receptor to detect the changes in the reflected light.
This approach has been used for decades, and I had an early version back in the 1980s. The latest optical heart rate monitors are vastly superior, but still have many accuracy issues. The most accurate form of heart rate monitoring is to use a chest strap that picks up the electrical signal from the heart. While a chest strap is not perfect, it works remarkably well as long as it has good contact with your skin, the battery is not flat, and it's not malfunctioning.
1 Anecdotal Accuracy
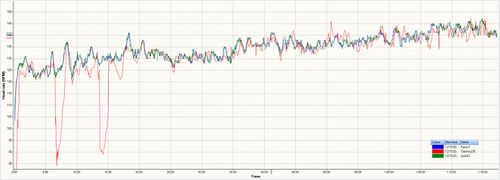
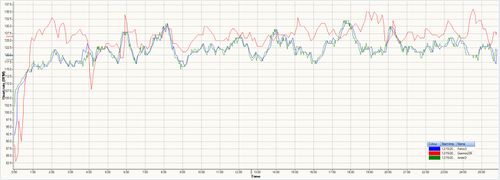
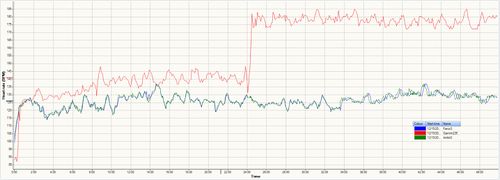
Many reviews of optical heart rate monitors will include anecdotal comparisons such as the ones shown below.
These comparisons can be quite useful to give a sense of the type of problems that are common with optical heart rate monitors. However, they provide no quantification of the accuracy, making it impossible to evaluate if one device is better than another. Therefore, I decided it would be worthwhile to undertake a slightly more rigorous approach.
2 Methodology
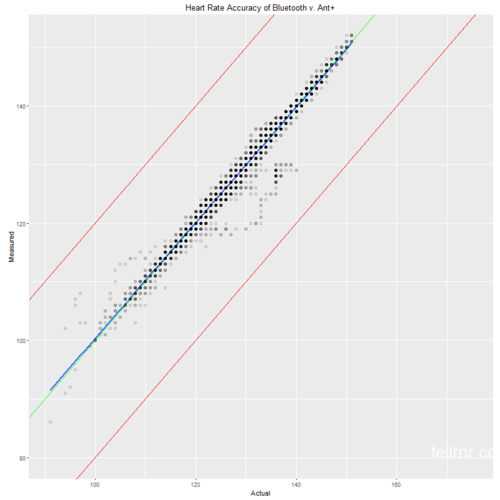
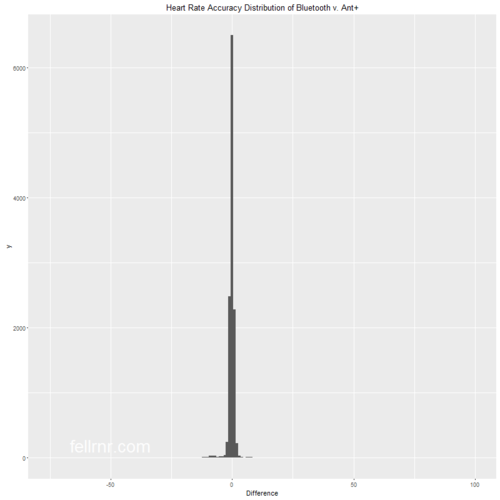
To evaluate the accuracy in a more quantifiable manner I've analyzed the heart rate of readings of several optical heart rate monitors compared with a chest strap based monitor. My first step was to verify that the chest strap based monitor is reasonably accurate. To do this, I ran with two different chest strap systems, a Garmin Ant+ (HRM4) and a Polar Bluetooth (H7). I compared over 10,000 readings and found that the two systems matched extremely well. I have uploaded the results below, using two different visualizations. The first graph shows the heart rate measured by the Garmin HRM4 on the horizontal against the Polar H7 on the vertical. If the two systems match exactly then the point will be on the green line of equality. You can see a few places where the two systems don't line up perfectly, but the vast majority of the readings align within a couple of heartbeats. I've used transparent points to give a better impression of the density of data, with black areas having at least 10 data points lining up. There is a blue regression line, which will be aligned with the green line if the system is accurate. I've also included two red lines that are 25 bpm away from the true value. The second graph shows the distribution of differences between the two systems, and again we can see that the vast majority of data points are within a couple of beats. For those with a statistical background, the standard deviation is 1.55 BPM with a bias of -0.06 BPM.
3 Garmin 235 Accuracy
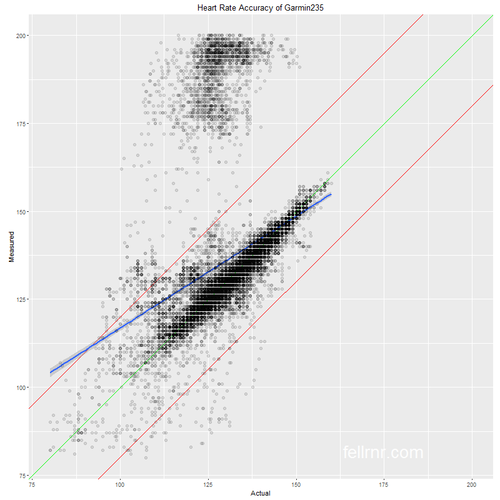
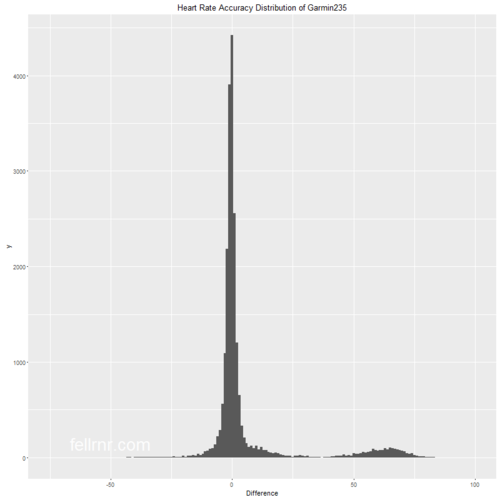
The graphs below highlight the accuracy problems off at the Garman 235's optical heart rate monitor. Of the 20,000 readings, slightly more than 10% were out by more than 25 BPM (demarked by the red lines on the first graph.) You can see a distinct cloud of points clustered high above the true readings. It's possible that this cloud represents the optical system becoming confused by the impact of my feet landing, as they are vaguely in the vicinity of my typical Cadence. Other runners have reported the phenomenon of optical heart rate monitors displaying wildly high values. You can also see this set of high values in the distribution graph, way it is displayed as a small bump to the right hand side of the main spike. The average error (standard deviation) is 19.1 BPM, with an average reading that was 5.7 BPM too high. If you're an experienced runner that has a good idea what your heart rate should be, then you may be able to ignore values that are out by more than 25 bpm. In that case, the standard deviation drops to 4.2 BPM with an average that is 0.03 too low. Of course, if you know your heart rate to within 25 BPM, then the 235 will only get you slightly closer.
