Marathon Survey
To better understand the various Marathon Training Plans, I have created a survey that is currently accepting responses. To respond to the survey, please go to Google Forms Marathon Survey.
- Most of the questions are optional, so leave blank those that don't apply. For instance, if this is your first marathon, leave the Personal Best blank.
- For marathon times, please use H:MM (e.g. "3:35") rather than H:MM:SS or "X Hours" (e.g. "3 hours"). I have code to parse the data, but the less ambiguity the better.
- For long run distances, you can enter just the distance in miles (e.g. "18"), or put "N Km" (e.g. "30 Km") if you're used to Kilometers.
- If you've run multiple marathons, and you can remember enough detail from the prior races, feel free to fill in the survey multiple times.
- If you used a plan and didn't get to start the race, or started the race and didn't finish, I'd still love to have your results. Knowing what doesn't work is just as important as knowing what does work.
We need a lot more data, but below are some initial results. These results are based on some post processing of the raw data, so they are not updated in real time.
Contents
1 Popularity
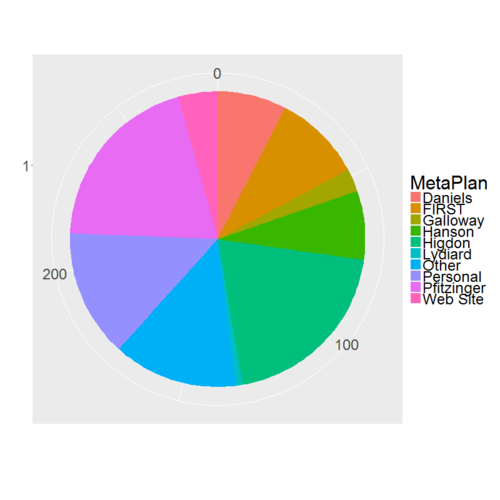
The Marathon survey attempts to gather data at the specific plan level, but until we have more data I will summarize it at the "meta-plan" level. For example, all of the Jack Daniels plans, such as Plan A, 2Q, etc., are all just considered "Daniels." You can also see a count of the number of entries for each plan in the table below.
2 Summary
This table shows the basic numeric analysis of the survey results so far. Some of the columns include a plus/minus value (standard deviation) which gives you an idea of how far the results vary from the average. Because many of the answers are optional, I've included the number of answers to the specific questions after the "#".
- Count. This is the number of responses to the specific plan.
- Improvement Over Expected. This is the difference between what the runner expected that finish time to be compared with the actual time. A negative number indicates they did better than they expected.
- Improvement Over Previous. This is the difference between the runners prior Personal Best and the actual finish time, and of course it only applies to runners that have previously done a marathon.
- Injured. This is the percentage of runners that reported they got injured, and on average more than 20% of runners on said yes.
- Overtrained. This is the percentage of runners that reported they were overtrained or burned out.
- Hit the Wall. For this survey, "hitting the wall" is simply described as a dramatic slowdown during the race, rather than attempting any more specific definition.
- DNF. Only one respondent reported that they did not finish the race, which makes me believe we are not getting good representation from that demographic.
- Overall rating. This is how well the plan was liked by the runner out of five points, with highest being most liked.
- Recommend. This is how likely the run is to recommend the plan to someone else, again down to five points with highest being most likely to recommend.
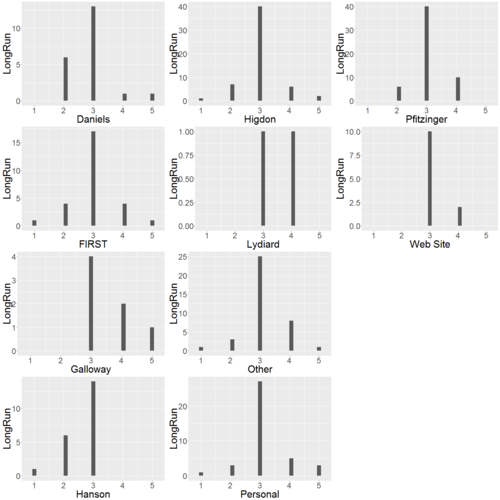
- Long run rating. This is a five-point scale, with three being just the right length long run, one being too short and five being too long.
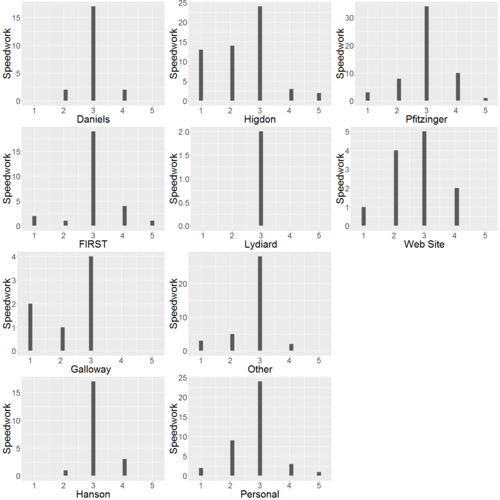
- Speedwork rating. This is a five-point scale, with three being just the right amount of speedwork, one being too little and five being too much.
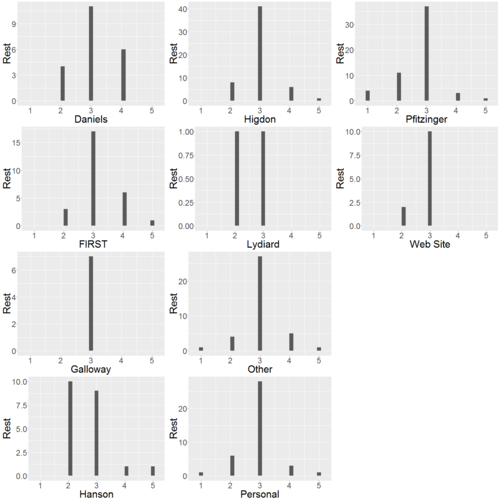
- Rest rating. This is a five-point scale, with three being just the right amount of rest and recovery, one being too little and five being too much.
- Completing long runs. This is the percentages of runners that were able to complete all of the long runs. I was a little surprised that the percentages were as low as they are.
- Completing speedwork. This is the percentage of runners that were able to complete all of the long runs. I'm perhaps less surprised by how low the percentages are than for the long runs.
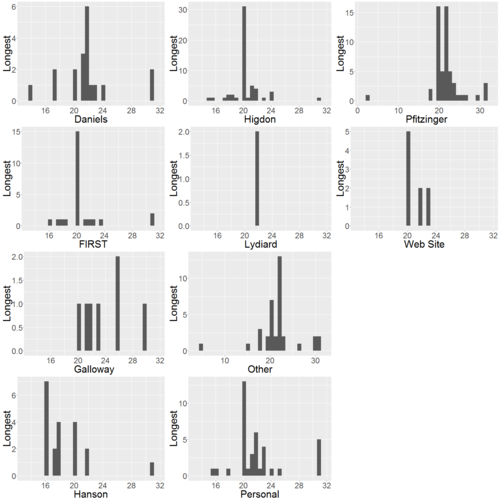
- Longest long run. This is how long the longest long run was that the runner completed.
| Plan | Count | Improvement Over Expected | Improvement Over Previous | Injured % | Overtrained % | Hit The Wall | DNF | Overall Rating | Recommend | Long Run Rating | Speedwork Rating | Rest Rating | %Completing Long Runs | %Completing Speedwork | Longest Long Run | How Many Marathons? |
|---|---|---|---|---|---|---|---|---|---|---|---|---|---|---|---|---|
| All Plans | 279 | 3.45 (+/-15.28,#235) | -13.08 (+/-24.04,#165) | 20.8% (#279) | 14.7% (#279) | 23.7% (#279) | 0.7% (#279) | 4.07 (+/-0.83,#277) | 4.08 (+/-1.07,#277) | 3.04 (+/-0.68,#279) | 2.79 (+/-0.82,#279) | 2.93 (+/-0.67,#279) | 76.7% (#279) | 61.6% (#279) | 21.24 (+/-3.70,#265) | 1.72 (+/-1.84,#279) |
| Daniels | 21 | 6.50 (+/-17.12,#16) | -15.85 (+/-11.26,#13) | 19.0% (#21) | 9.5% (#21) | 23.8% (#21) | 0.0% (#21) | 4.24 (+/-0.70,#21) | 4.38 (+/-0.67,#21) | 2.86 (+/-0.73,#21) | 3.00 (+/-0.45,#21) | 3.10 (+/-0.70,#21) | 81.0% (#21) | 71.4% (#21) | 21.82 (+/-4.02,#19) | 1.95 (+/-1.86,#21) |
| FIRST | 27 | 8.90 (+/-10.08,#20) | -12.15 (+/-41.46,#13) | 29.6% (#27) | 18.5% (#27) | 37.0% (#27) | 7.4% (#27) | 3.67 (+/-1.04,#27) | 3.70 (+/-1.17,#27) | 3.00 (+/-0.78,#27) | 3.04 (+/-0.81,#27) | 3.19 (+/-0.68,#27) | 81.5% (#27) | 44.4% (#27) | 20.81 (+/-3.41,#25) | 1.07 (+/-1.33,#27) |
| Galloway | 7 | 5.60 (+/-15.79,#5) | 13.00 (+/-0.00,#1) | 14.3% (#7) | 0.0% (#7) | 42.9% (#7) | 0.0% (#7) | 3.71 (+/-0.49,#7) | 3.57 (+/-1.13,#7) | 3.57 (+/-0.79,#7) | 2.29 (+/-0.95,#7) | 3.00 (+/-0.00,#7) | 85.7% (#7) | 71.4% (#7) | 24.00 (+/-3.51,#7) | 0.71 (+/-1.89,#7) |
| Hanson | 21 | 6.81 (+/-16.97,#21) | -11.44 (+/-47.95,#18) | 19.0% (#21) | 23.8% (#21) | 23.8% (#21) | 0.0% (#21) | 4.05 (+/-0.94,#20) | 4.10 (+/-1.18,#21) | 2.62 (+/-0.59,#21) | 3.10 (+/-0.44,#21) | 2.67 (+/-0.80,#21) | 76.2% (#21) | 57.1% (#21) | 18.65 (+/-3.54,#20) | 2.33 (+/-1.74,#21) |
| Higdon | 56 | 5.35 (+/-22.63,#46) | -11.33 (+/-21.59,#21) | 32.1% (#56) | 10.7% (#56) | 26.8% (#56) | 0.0% (#56) | 4.00 (+/-0.90,#55) | 3.98 (+/-1.11,#55) | 3.02 (+/-0.67,#56) | 2.41 (+/-1.02,#56) | 3.00 (+/-0.57,#56) | 73.2% (#56) | 69.6% (#56) | 20.36 (+/-2.21,#54) | 1.02 (+/-1.58,#56) |
| Lydiard | 2 | -0.50 (+/-0.71,#2) | 0.00 (+/-0.00,#1) | 0.0% (#2) | 0.0% (#2) | 0.0% (#2) | 0.0% (#2) | 4.00 (+/-0.00,#2) | 4.50 (+/-0.71,#2) | 3.50 (+/-0.71,#2) | 3.00 (+/-0.00,#2) | 2.50 (+/-0.71,#2) | 50.0% (#2) | 50.0% (#2) | 22.00 (+/-0.00,#2) | 0.00 (+/-0.00,#2) |
| Other | 38 | 1.88 (+/-12.26,#34) | -13.85 (+/-15.85,#27) | 15.8% (#38) | 15.8% (#38) | 23.7% (#38) | 0.0% (#38) | 4.08 (+/-0.63,#38) | 4.32 (+/-1.03,#37) | 3.13 (+/-0.70,#38) | 2.76 (+/-0.68,#38) | 3.03 (+/-0.68,#38) | 68.4% (#38) | 47.4% (#38) | 21.55 (+/-4.57,#36) | 1.74 (+/-1.88,#38) |
| Personal | 39 | 3.43 (+/-14.43,#30) | -10.86 (+/-17.69,#21) | 10.3% (#39) | 12.8% (#39) | 20.5% (#39) | 0.0% (#39) | 4.33 (+/-0.74,#39) | 4.03 (+/-1.16,#39) | 3.15 (+/-0.78,#39) | 2.79 (+/-0.77,#39) | 2.92 (+/-0.66,#39) | 82.1% (#39) | 71.8% (#39) | 22.19 (+/-3.93,#38) | 2.18 (+/-2.10,#39) |
| Pfitzinger | 56 | -0.59 (+/-5.85,#51) | -16.67 (+/-13.68,#43) | 12.5% (#56) | 17.9% (#56) | 14.3% (#56) | 0.0% (#56) | 4.16 (+/-0.85,#56) | 4.14 (+/-0.96,#56) | 3.07 (+/-0.53,#56) | 2.96 (+/-0.79,#56) | 2.75 (+/-0.74,#56) | 75.0% (#56) | 60.7% (#56) | 21.83 (+/-3.98,#55) | 2.36 (+/-1.80,#56) |
| Web Site | 12 | -2.40 (+/-19.26,#10) | -6.43 (+/-15.86,#7) | 50.0% (#12) | 16.7% (#12) | 25.0% (#12) | 0.0% (#12) | 3.92 (+/-0.67,#12) | 4.08 (+/-1.24,#12) | 3.17 (+/-0.39,#12) | 2.67 (+/-0.89,#12) | 2.83 (+/-0.39,#12) | 91.7% (#12) | 66.7% (#12) | 21.11 (+/-1.36,#9) | 1.42 (+/-1.73,#12) |
Some observations and notes:
- We have too few responses to draw firm conclusions, so apply caution to these results.
- My analysis is in the early stages, so results may change as I iron out bugs.
- Long runs are capped at 31 miles, so a runner that does a 100-mile long run does not skew the results too much.
- Hanson has the shortest Long Runs, but the average is still quite a bit longer than the 16 miles they recommend.
- A lot of respondents do their own plan ("Personal") and there are a good number where there are only a few responses for a plan, so they've been put under "other".
- The number of runners that hit the wall is quit high.
- The low number of DNFs suggests runners who DNF are not responding.
- Almost everyone likes their plan; there are only 10 responders who put 1 star against their plan.
3 Overall Rating
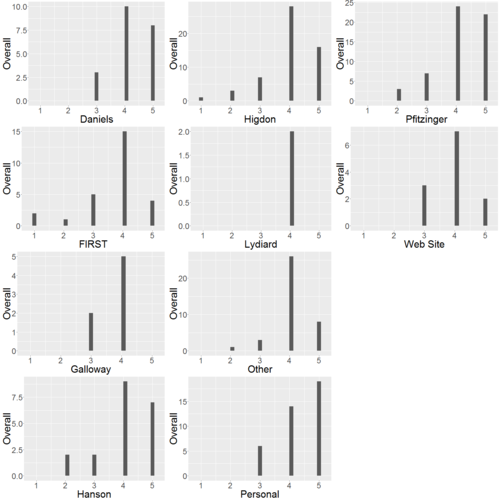
Most runners like their plan, with average ratings above 3.0 for all plans. FIRST, and Higdon have a few one/two star ratings, and Pfitzinger/Hanson have some two star ratings.
4 Recommend to Others
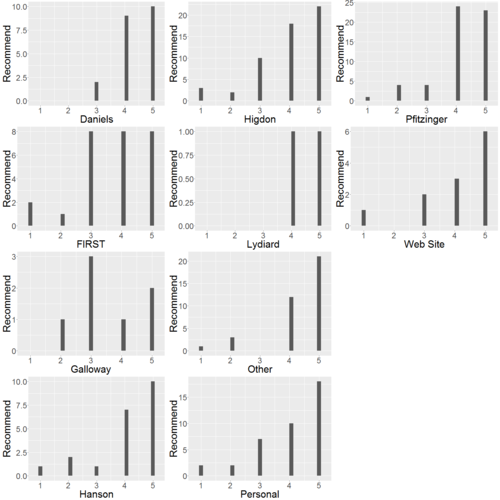
This is similar to the overall rating, though runners are slightly more likely to recommend a plan than their rating would suggest.
5 Use Again?
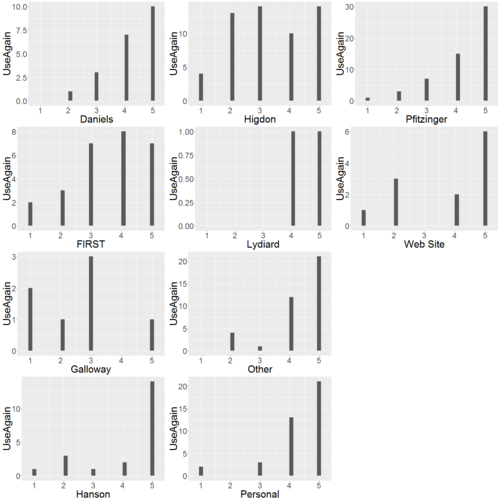
The distribution of runners inclination to use their plan again is interesting. Generally, runners seem to be inclined to use the same plan again. Higdon and FIRST have a rather more doubtful runners, while Hanson uses are more positive.
6 Length of the Longest Long Run
The average longest Long Run is over 20 miles for most plans, which is no surprise. I don't have enough data to report on the Long Run distance against the risk for Hitting The Wall, but preliminary results indicate the reasonable expectation that the risk goes down with longer long runs.
7 Long Run's Long Enough?
Most runners seem to feel long run is about the right length. Jack Daniels had a surprising portion of felt it was too short, as did Hanson.
8 Enough Rest?
Hanson runners wanted more rest, though some of them also wanted less rest. Other plans seemed to get it more or less right.
