Difference between revisions of "Comparison of Cadence Monitors"
User:Fellrnr (User talk:Fellrnr | contribs) (Created page with "The cheapest way is to measure your Cadence is to simply count how many times your foot touches the ground in a minute. However, it's much easier to use a Best Running W...") |
(No difference)
|
Revision as of 11:45, 30 May 2016
The cheapest way is to measure your Cadence is to simply count how many times your foot touches the ground in a minute. However, it's much easier to use a running watch that displays cadence. Some watches will use a small Footpod attached to your shoe, but others make use of an internal accelerometer. Garmin makes a Heart Rate Monitor (the HRM4) that will also measure Cadence. There's more advanced options, such as RunScribe which make Footpods that measure a wide range of biomechanical data in addition to pace and Cadence, including Braking G's, Impact G's, Ground Contact Time, Foot Strike, and more.
1 Cadence Accuracy
To understand the relative accuracy of different ways of measuring cadence, the best option is to perform certain statistical analysis. To do this, I recorded data from many runs and wrote some custom software to analyze the results. I've used a Garmin Footpod as the reference standard, as I believe this is the most accurate approach. This is a time-consuming process, but provides a numeric value that you can use to choose the best device.
| Device | Trueness | Precision | Review |
|---|---|---|---|
| Garmin HRM4 | -1.0 | 3.8 | |
| Garmin 235 | -1.6 | 6.2 | Garmin 235 Review |
I use the ISO 5725 definition of Accuracy as the combination of trueness and precision, which is illustrated below.
2 Garmin HRM4 (HRM-Run)
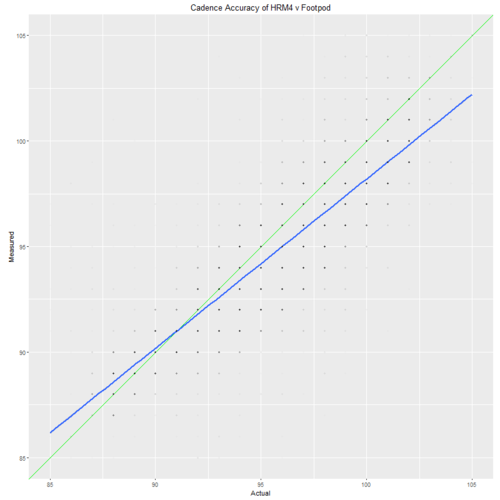
The Garmin HRM4 uses accelerometers in the chest strap to measure cadence. On the graph below, points falling on the green diagonal line accurate, having the same value on both devices. The further the points are from the green line less accurate they are. There is a blue regression line which in an accurate device would be in line with the green identity line. The points are added transparently to give an indication of density, with a full black color representing 100 overlapping readings. The chart represents well over 10,000 measurements, which I believe is enough to give a good indication of accuracy. The Garmin HRM4 has a trueness of -1.0 steps per minute (SPM), which suggests that over the course of a run, it will give you an average reading that is only one SPM too low. Its precision is 3.8 SPM, which means that at any given moment the reading is unlikely to be out by about four steps per minute, which is a little more than I would like.
3 Anecdotal Comparisons
The simplest way of evaluating the accuracy of the cadence measurement is to run with several devices, and look at the graphs they produce. This provides some visual indication of the types of issues that devices may encounter, but it provides no quantification of their accuracy. I've included a number of these simple, anecdotal comparisons as background, but there's no substitute for the statistical analysis above.
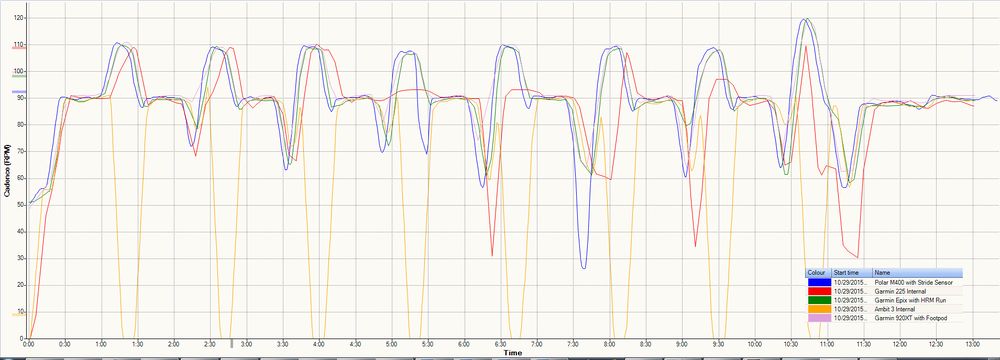
The graph above is from a High Intensity Interval Training session, which is a challenging test of Cadence monitors. The Warmup and Cooldown sections of the run are not included, just the intervals. You can see the cadence rise to above 100 during the fast, high intensity intervals, then drop back to my more normal 90, then a further drop as I walk for a short period before commencing the next interval. I don't normally walk, but I wanted to challenge the cadence monitors a little extra. I avoided looking at any device during the run, as that can prevent the internal accelerometer based systems from operating without the normal arm swing.
- I wore five watches, two Footpods and the Garmin HRM Run sensor for the run.
- The blue line is from a Polar M400 with the Polar Stride Sensor Footpod. The Stride Sensor is huge, but it seems to provide the best data. The Polar data is smoother (greater sampling frequency), and reflects the changes in Cadence a little better than other sources. For instance, I stood stationary for a few seconds around the 7:30 mark, and the Polar reflects this drop better.
- The purple line is from a Garmin 920XT with a Garmin Footpod. This is very nearly as good as the Polar data, and matches the changes fairly accurately.
- The green line is from a Garmin Epix with the Garmin HRM Run heart rate strap that also monitors cadence. This matches the Garmin Footpod nicely, showing a similar sampling frequency.
- The red line is from a Garmin 225 that is relying on its internal accelerometer. The Garmin 225 is firmly strapped onto my wrist to ensure its optical heart rate monitor is effective. This is rather tighter than I would like, and mostly it does okay. You can see it's a little delayed in some of its responses, and at the 5:00 and 6:30 minute marks it misses the rise completely. While it's far from perfect, it does a reasonable job.
- The orange line is from an Suunto Ambit3 using its internal accelerometer. The Ambit3 was reasonably firmly strapped to my arm, but nowhere near as tight as the Garmin 225. I suspect it's this looseness that causes the poor data for the Ambit3. You can see that on the fast intervals the Ambit3 loses the plot completely and assumes that my cadence drops to zero.
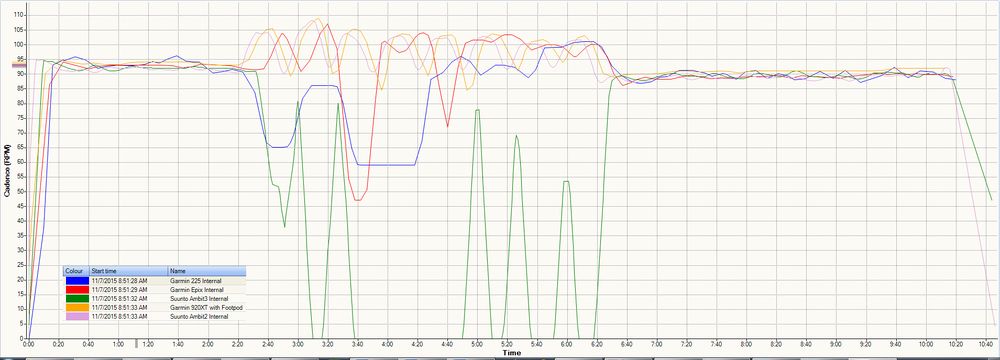
The graph above is another test during a High Intensity Interval Training session, and again, the Warmup and Cooldown sections of the run are not included. You can see that under steady state conditions, all the watches do reasonably well, but not during the interval section.
- I wore five watches, only one with a Footpod and the others with just their internal sensors.
- The orange line is from a Garmin 920XT with a Garmin Footpod. This is the gold standard for this run and I'm assuming it's accurate based on the tests above.
- The purple line is from the Suunto Ambit2 and matches fairly well with the Footpod.
- The red line is from a Garmin Epix which does nearly as well as Ambit2, but there are a couple of drop outs where it thinks the cadence has dropped rather than gone up.
- The blue line is from a Garmin 225 and it does quite poorly, not really following the interval session at all.
- The green line is from an Suunto Ambit3 where again you can see it loses touch with reality completely and assumes that my cadence drops to zero.
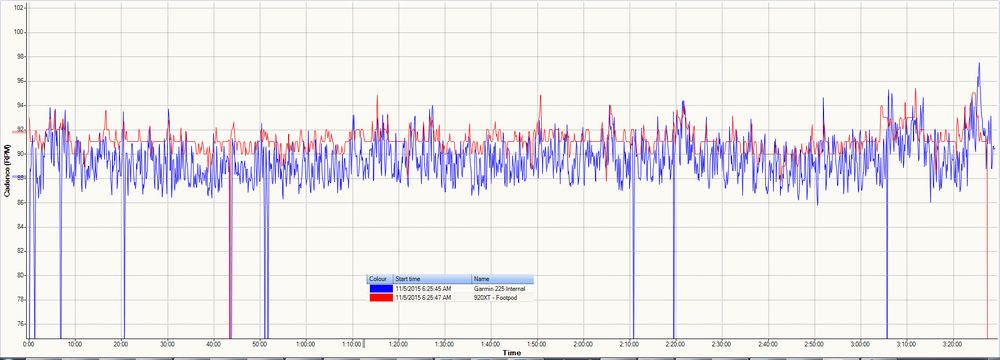
The graph above is the comparison of a Garmin 920XT with a Footpod (red line) with a Garmin 225 using its internal accelerometer (blue line). You can see the internal sensor is far noisier, but worse, it has an overall bias. The Footpod showed an average cadence of 91.1 while the internal sensor was 89.3. That's not a huge difference, but it's far from ideal.
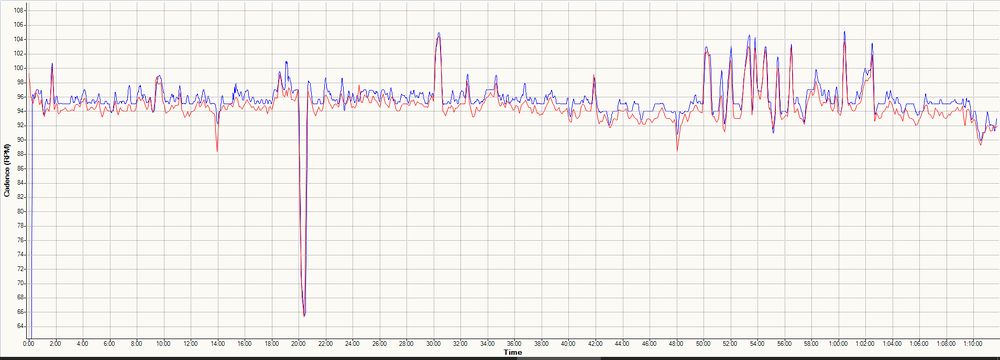
The Polar V800 provides reasonably good tracking of Cadence, though it is biased a little high. For this example run it had an average of 95.5 rather than 94.6. The V800 tracks the walking break at 20 minutes, the faster pace at 30 minutes, and the Fartlek beginning at 50 minutes.


