2011 Statistics
From Fellrnr.com, Running tips
Revision as of 13:43, 2 January 2012 by User:Fellrnr (User talk:Fellrnr | contribs) (Created page with "While 2011 had similar overall mileage to 2010, it was achieved rather unevenly, as you can see from the chart below. [[File:ST 2011 Statistics.jpg|none|thumb|800px|2011 Monthly ...")
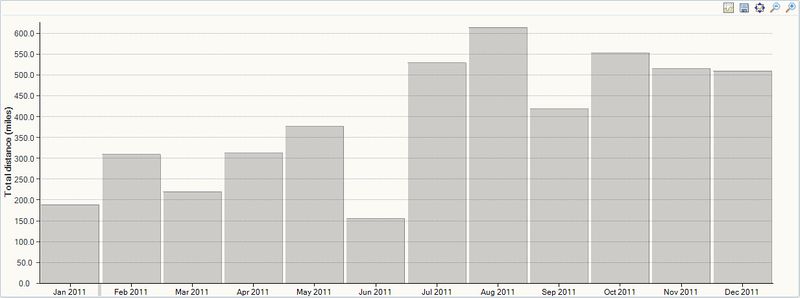
While 2011 had similar overall mileage to 2010, it was achieved rather unevenly, as you can see from the chart below.
I had some nagging injuries early in the year, and took quite a bit of time off in June when I went back home to England. It was not until the second half of the year that my training came together and I focused on the 2011 North Coast 24 Hour National Championships. I didn't race much this year due to the early injuries and then later because I wanted to focus on the national championships.
1 Statistics
Statistics for 2011 with some 2010, 2009 & 2008 comparisons. For my ongoing statistics, see Training Macrolog.
| 2011 | 2010 | 2009 | 2008 | |
|---|---|---|---|---|
| Total Mileage | 4699 | 4000 | 2978 | |
| Max Monthly Mileage | 614 | 470 | 476 | 346 |
| Min Monthly Mileage | 156 | 269 | 161 | 161 |
| Total Training Hours | 627 | 663 | 653 | 488 |
| Training Time with (HR > 152) | N/A | N/A | 67 | 50 |
| Number of runs > 26 miles | 34 | 77 | 31 | 7 |
| Number of runs > 20 miles | 110 | 116 | 73 | 21 |
| Number of runs > 16 miles | 181 | 150 | 142 | 60 |
| Number of runs | 255 | 217 | 234 | 278 |
| Longest Race (Time) | 24:00 (North Coast 24 Hour) | 24:00 (Hinson Lake 24 Hour) | 33:51 (Massanutten 100) | 23:15 (Umstead 100) |
| Longest Race (Distance) | 146 (North Coast 24 Hour) | 133 (Hinson Lake 24 | 132 (Hinson Lake 24 | 100 (Umstead 100) |
| Total Races | 5 | 17 | 12 | 6 |
| First Place Finishes | 0 | 3 | 4 | 0 |
| Second Place Finishes | 1 | 2 | 2 | 0 |
