Lumo Run Review
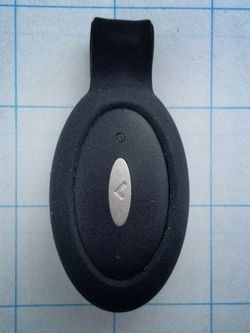
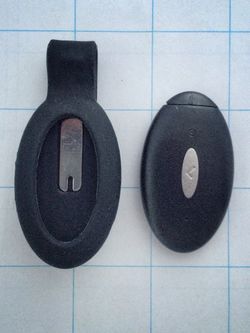
Lumo Run is a Running Sensor that mounts on the rear waistband of your shorts. It measures a number of aspects of your Running Form, including Cadence, Vertical Osculation (bounce), breaking, pelvic drop, and pelvic twist. Lumo uses a 9-axis sensor, which is a 3-axis accelerometer plus a 3-axis gyroscope and a 3-axis magnetometer allowing it to sense movement far better than sensors that rely on the accelerometer alone. It's this 9-axis sensor that allows some of the potentially interesting metrics to be gathered.
- Cadence. I believe Cadence is the single most important running metric, and while Lumo seems accurate, the lack of real time data is especially annoying here.
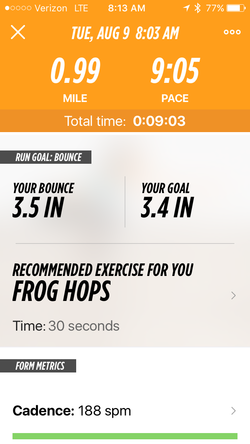
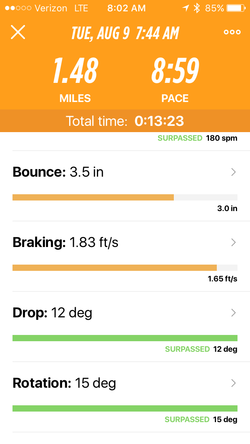
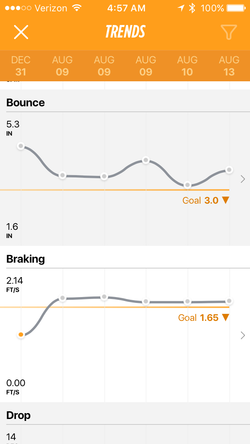
- Vertical Oscillation. This is how much your torso moves up and down with each stride. It is generally believed that less Vertical Oscillation is a better, but I suspect that this is an oversimplification. Some are part of a runner's vertical movement is likely to be elastic in nature (consider a bouncing rubber ball), some of the vertical motion will be while the runner is airborne (ballistic), and some of the vertical motion is the deceleration as the runner lands. So it seems likely to me that excessive vertical oscillation is bad, but it's a tricky to know what excessive is likely to be, or how to correct it. The measure of Vertical Oscillation (which Lumo terms "bounce") is similar to other devices and I will perform some verification using an objective measure in the future. Lumo recommend less than 3"/7.6cm of bounce.
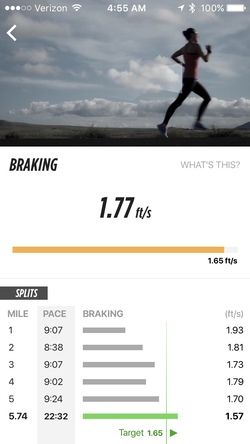
- Breaking. Lumo measures how much your torso slows up on each stride, and recommends that it should be under 1.65 feet/second. I'll be curious to see how this compares to RunScribe's foot breaking and Wahoo TICKR Run's smoothness. (I'm not sure why this is measured as a velocity rather than acceleration.)
- Drop. As you run, your side of your pelvis that is supported by your leg tends to move up and the other side down. This pelvic drop might be a waste of energy, so Lumo recommends it should be under 12 degrees.
- Rotation. As your support leg moves backwards, there is a tendency for the pelvis to twist so the supported side if further back and the side with the leading leg is further forward. Tight hip flexors make this a lot worse. Lumo recommends less than 15 degrees.
- Ground Contact Time (future). Lumo are planning on adding this metric, along with stride length. (It's not clear why they can't calculate stride length from pace and cadence.)
Lumo Run is available for Error: Could not parse data from Amazon! which is a comparable price for a 9-axis device. (Early versions of the Lumo have a fault where light causes a bad battery reading, so you have to insert it into its holder the other way round.)
1 Recommendation
I think that the Lumo has potential, but needs more development.
- Other than Cadence which is more easily and effectively gathered using cheaper technology, there's not much evidence that any of the other metrics are valuable to a runner. While reducing "breaking" may seem intuitively a good thing, I'd like to see some research to back this up.
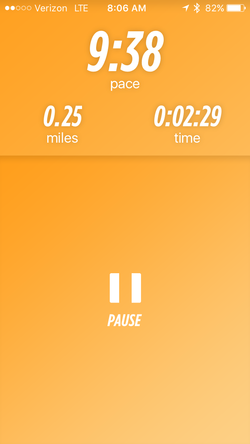
- Unfortunately, you not only have to run with your smartphone for Lumo to work, but there's no display of any of the data in real time, not even Cadence.
- You have to wait until after your run to get summary data, and there are no graphs of how the metrics changed over the course of the run though you can see the metrics for each split.
- There are some audio "coaching" messages, but I found those both annoying and useless. These audio messages are no substitute for real time data.
- There's no option to export the data for analysis or importing into other tools.
- There's no "treadmill mode"; you can use it on a treadmill, but GPS is still used on your phone, which is less than ideal.
