Difference between revisions of "BSX"
User:Fellrnr (User talk:Fellrnr | contribs) |
User:Fellrnr (User talk:Fellrnr | contribs) m (comment: batch update) |
||
| (3 intermediate revisions by the same user not shown) | |||
| Line 1: | Line 1: | ||
{{DISPLAYTITLE:BSX Lactate Threshold Monitor}} | {{DISPLAYTITLE:BSX Lactate Threshold Monitor}} | ||
| − | BSX is a simple, easy to use [[Running Sensors| Running Sensor]] that estimates your [[Lactate Threshold]], but I don't believe its results are correct or useful. You just wear the BSX monitor in a custom calf compression sleeve that it comes with, along with the BSX app on your phone, while running on a treadmill. The BSX app tells you what pace to run at, which increases every 3 minutes until you can't continue, at which point it (probably) tells you (it's guess at) your [[Lactate Threshold]] pace. Sadly, while the BSX simple and easy to use, the results are rather dubious and it's unclear to me if it does a better job than simply using an estimate of your 10K race pace. (This review is for the second generation BSX; for results of the first generation, see [[BSX Gen1]].) | + | BSX is a simple, easy to use [[Running Sensors| Running Sensor]] that estimates your [[Lactate Threshold]], but I don't believe its results are correct or useful. You just wear the BSX monitor in a custom calf compression sleeve that it comes with, along with the BSX app on your phone, while running on a treadmill. The BSX app tells you what pace to run at, which increases every 3 minutes until you can't continue, at which point it (probably) tells you (it's guess at) your [[Lactate Threshold]] pace. Sadly, while the BSX simple and easy to use, the results are rather dubious and it's unclear to me if it does a better job than simply using an estimate of your 10K race pace. (This review is for the second generation BSX; for results of the first generation, see [[BSX Gen1]].) '''BSX has abandoned sales of this sensor, and will decommission the cloud services in Feb 2019. However, they have released the code to their [[Connect IQ]] data field to the open source community. '''More at http://blog.bsxtechnologies.com/2018/02/09/bsxinsight/ |
{| class="wikitable" | {| class="wikitable" | ||
|- valign="top" | |- valign="top" | ||
| Line 33: | Line 33: | ||
* '''Single Protocol'''. The BSX app supports a single protocol that uses an incremental load test with 3 minute stages. If you want to do any other test protocol, such as longer stages or something closer to the MLSS protocol, you can't. | * '''Single Protocol'''. The BSX app supports a single protocol that uses an incremental load test with 3 minute stages. If you want to do any other test protocol, such as longer stages or something closer to the MLSS protocol, you can't. | ||
* '''Single User'''. The BSX is sold as a single user device, and the software does not readily support sharing the device. | * '''Single User'''. The BSX is sold as a single user device, and the software does not readily support sharing the device. | ||
| − | * '''Usefulness'''. I have two concerns around the usefulness of BSX. The first issue is that [[Tempo Runs]] don't appear to be an effective form of training, so the value of knowing your Lactate Threshold seems rather limited. However, the BSX could still be of value if it's a viable measure of training intensity, especially for [[High Intensity Interval Training]]. Typically, [[Heart Rate Drift| Heart Rate Training suffers from drift]], so something more reliable might be useful. However, in my testing I found that the BSX did not seem to meaningfully reflect my training intensity. During either the BSX incremental treadmill tests or during [[High Intensity Interval Training]] the BSX showed a relatively stable | + | * '''Usefulness'''. I have two concerns around the usefulness of BSX. The first issue is that [[Tempo Runs]] don't appear to be an effective form of training, so the value of knowing your Lactate Threshold seems rather limited. However, the BSX could still be of value if it's a viable measure of training intensity, especially for [[High Intensity Interval Training]]. Typically, [[Heart Rate Drift| Heart Rate Training suffers from drift]], so something more reliable might be useful. However, in my testing I found that the BSX did not seem to meaningfully reflect my training intensity. During either the BSX incremental treadmill tests or during [[High Intensity Interval Training]] the BSX showed a relatively stable [[Muscle Oxygen Saturation]]. This is in contrast with the [[Moxy]] system that showed a better relationship between intensity and [[Muscle Oxygen Saturation]]. The only noticeable change in muscle oxygenation that I saw with BSX was during the initial transition from walking to running. |
=BSX Validity= | =BSX Validity= | ||
I have a number of concerns with the validity of the results of the BSX. | I have a number of concerns with the validity of the results of the BSX. | ||
| − | * ''' | + | * '''Limited independent validation'''. There is a [http://link.springer.com/article/10.1007/s12283-016-0198-6 study by the University of Waikato] that found a good correlation between the BSX results and some measures of Lactate Threshold. I have a number of concerns with this study. It used the first generation of BSX which has some rather obvious failings, and it does not compare the BSX against a good reference standard for Lactate Threshold (MLSS). The study used three estimates of Lactate Threshold based on blood lactate testing; one is the common Onset of Blood Lactate Accumulation (OBLA), but the other two were somewhat unusual. They found that the BSX was +/- 19 watts of OBLA, itself not a great measure of Lactate Threshold. So, the Gen 1 BSX showed a better correlation with a bad standard than research shows between those standards and the true Lactate Threshold (MLSS). The main conclusion I would draw from this study is that a crude estimate of LT from 10K pace is just as good as the crude estimates from an incremental stress test with blood lactate draws. <br/>[[File:BSX OBLA.jpg|none|thumb|150px|The Lactate Threshold estimates using OBLA and BSX, with the vertical ticks as 20w intervals.]] |
* '''Black Box'''. The BSX algorithm is proprietary and not clearly documented, which means it's hard to know if there is any scientific basis for their approach. BSX states that their algorithm is patented, but nowhere do they indicate what their patent number is. I believe it is patent US20130096403; see below for details. | * '''Black Box'''. The BSX algorithm is proprietary and not clearly documented, which means it's hard to know if there is any scientific basis for their approach. BSX states that their algorithm is patented, but nowhere do they indicate what their patent number is. I believe it is patent US20130096403; see below for details. | ||
* '''BSX Validation'''. BSX has performed their own validation but the results are not published. The reviews give some insight into the methodology that BSX uses, but the details are unclear. These reviews indicate that BSX did not use the gold standard of MLSS for [[Lactate Threshold]] in their validation. Instead they used an incremental treadmill test with lactate measurement from a blood draw, and relied on the rather poor Carmichael Training Systems determination of [[Lactate Threshold]]. I believe that this indicates that BSX has performed their internal validation against a seriously flawed baseline. (See [[Lactate Threshold]] for details.) | * '''BSX Validation'''. BSX has performed their own validation but the results are not published. The reviews give some insight into the methodology that BSX uses, but the details are unclear. These reviews indicate that BSX did not use the gold standard of MLSS for [[Lactate Threshold]] in their validation. Instead they used an incremental treadmill test with lactate measurement from a blood draw, and relied on the rather poor Carmichael Training Systems determination of [[Lactate Threshold]]. I believe that this indicates that BSX has performed their internal validation against a seriously flawed baseline. (See [[Lactate Threshold]] for details.) | ||
| Line 47: | Line 47: | ||
* '''Sensor Location'''. A minor concern is the location of the sensor on the calf, where it may be more affected by changes in biomechanics than using the quads. | * '''Sensor Location'''. A minor concern is the location of the sensor on the calf, where it may be more affected by changes in biomechanics than using the quads. | ||
=Testing BSX= | =Testing BSX= | ||
| − | I performed a number of tests of the BSX. Other than a few tests when | + | I performed a number of tests of the BSX. Other than a few tests when I had an issue with excessive ambient light, the BSX always provided me with an estimate of my Lactate Threshold. The answer it gave depended directly on the input I gave the app about my 10K pace. As noted above, the estimate would vary wildly. Below is the data I captured from one of the tests. You can see the sudden rise in heart rate at the three minute mark that represents the end of the initial walk and the beginning of the running, and this is followed by a steady rise in heart rate. The red line represents the muscle oxygen saturation recorded by the BSX, and you can see that it detects the change from walking to running with a small drop, but thereafter remains relatively level. There is a slight drop from the first running section through to about the 15 minute mark, after which it levels off. You see a few small dropouts, but this might be an issue with the communications from the BSX to my watch. It's hard to see from this muscle oxygenation data that there is any indication of a change that would represent a lactate threshold. In fact it's hard to believe that the BSX is even really determining muscle oxygenation. (Note: the muscle oxygenation data is recorded as cadence data for compatibility.) |
[[File:BSX LT Test.jpg|none|thumb|500px|Incremental Lactate Threshold test with the BSX.]] | [[File:BSX LT Test.jpg|none|thumb|500px|Incremental Lactate Threshold test with the BSX.]] | ||
I did all my tests with both the BSX and the [[Moxy]] for comparison. Unfortunately, I had a battery problem with my Moxy so I don't have as many samples to show. The image below shows the rising heart rate in blue, the BSX in red, and the Moxy in green. You can see that both the BSX and the Moxy drop as I transition from walking to running, but you'll notice that the Moxy continues to drop as the intensity increases. This is what I'd expect to see from a muscle oxygenation sensor. In my testing I've always seen the Moxy detect a drop in muscle oxygenation, and never seen one from any of my BSX sensors. I have no way of verifying whether the Moxy is accurate, but I can see that it is the least functioning. | I did all my tests with both the BSX and the [[Moxy]] for comparison. Unfortunately, I had a battery problem with my Moxy so I don't have as many samples to show. The image below shows the rising heart rate in blue, the BSX in red, and the Moxy in green. You can see that both the BSX and the Moxy drop as I transition from walking to running, but you'll notice that the Moxy continues to drop as the intensity increases. This is what I'd expect to see from a muscle oxygenation sensor. In my testing I've always seen the Moxy detect a drop in muscle oxygenation, and never seen one from any of my BSX sensors. I have no way of verifying whether the Moxy is accurate, but I can see that it is the least functioning. | ||
| Line 54: | Line 54: | ||
Patent US20130096403 A1 (Apparatus and method for improving training threshold), which is a patent for determining the Lactate Threshold using an incremental stress test with an infrared sensor. I feel reasonably confident that this is the BSX patent, but I could not confirm this and BSX seem to carefully avoid any reference to the details of their patent. The patent describes an experiment using a 3 minute incremental treadmill run on 34 subjects, which looks like multiple aspects of muscle oxygenation (SmO2): | Patent US20130096403 A1 (Apparatus and method for improving training threshold), which is a patent for determining the Lactate Threshold using an incremental stress test with an infrared sensor. I feel reasonably confident that this is the BSX patent, but I could not confirm this and BSX seem to carefully avoid any reference to the details of their patent. The patent describes an experiment using a 3 minute incremental treadmill run on 34 subjects, which looks like multiple aspects of muscle oxygenation (SmO2): | ||
** '''SmO2'''. The basic measure of SmO2 showed a good correlation between SmO2 and Lactate, but only in 19 of 34 subjects (56%). The example correlation uses Lactate ranges 0.6 to 2.5, suggesting that the correlation might only exist at relatively low intensities. | ** '''SmO2'''. The basic measure of SmO2 showed a good correlation between SmO2 and Lactate, but only in 19 of 34 subjects (56%). The example correlation uses Lactate ranges 0.6 to 2.5, suggesting that the correlation might only exist at relatively low intensities. | ||
| − | ** '''Rate of change of SmO2. '''This is the slope of the line drawn through the | + | ** '''Rate of change of SmO2. '''This is the slope of the line drawn through the SmO2 during a stage. Here the correlation existed only for 11 of the 34 subjects (32%). Here the chart shoes a Lactate range of 1.2 to 6.8, which is a much higher intensity and crosses what BSX consider to be the marker for Lactate Threshold (even though there is a fairly linear increase up to the 6.8 mark.) |
** '''Magnitude of the reduction in SmO2. '''It looks like they do an exponential fit for the SmO2 and then find the rate of decay constant. This gives a correlation for 25 of the 34 subjects (73%). Here the charts are rather odd; the increment test chart shows Lactate in the range 0.6 to 2.0, but the regression chart only uses value of 0.6 to 1.3 (pretty much resting Lactate levels). | ** '''Magnitude of the reduction in SmO2. '''It looks like they do an exponential fit for the SmO2 and then find the rate of decay constant. This gives a correlation for 25 of the 34 subjects (73%). Here the charts are rather odd; the increment test chart shows Lactate in the range 0.6 to 2.0, but the regression chart only uses value of 0.6 to 1.3 (pretty much resting Lactate levels). | ||
** '''Rate of decay of SmO2'''. Like the magnitude, this uses the rate of decay from the exponential fit, but this only gives a correlation for 9 of the 34 subjects (26%). The charts for this have a Lactate range of 0.8 to 4.0, a reasonable range for a Lactate Threshold test. | ** '''Rate of decay of SmO2'''. Like the magnitude, this uses the rate of decay from the exponential fit, but this only gives a correlation for 9 of the 34 subjects (26%). The charts for this have a Lactate range of 0.8 to 4.0, a reasonable range for a Lactate Threshold test. | ||
| Line 60: | Line 60: | ||
=Independent Reviews= | =Independent Reviews= | ||
BSX pointed me to three individuals who have reviewed their device; Tony Vienneau (Slowtwitch.com), Matt Fisher (triathletesdiary.com), and Ray Maker (dcrainmaker.com). | BSX pointed me to three individuals who have reviewed their device; Tony Vienneau (Slowtwitch.com), Matt Fisher (triathletesdiary.com), and Ray Maker (dcrainmaker.com). | ||
| − | * Tony's review on slowtwitch.com mentioned that he used the BSX to perform multiple tests (30-40). Tony noted that the muscle oxygenation value displayed on the BSX varied with fatigue, which was different to my results where the value seemed reasonably static regardless of activity level. Tony mentioned that he had a Blood Lactate test performed that corresponded with the BSX results, but gave no further details. Tony mentioned to me that he generally saw changes in displayed SmO2 that corresponded to intensity. He also found that he got an error if he ran at an easy pace with the BSX. Tony's review is available at [ | + | * Tony's review on slowtwitch.com mentioned that he used the BSX to perform multiple tests (30-40). Tony noted that the muscle oxygenation value displayed on the BSX varied with fatigue, which was different to my results where the value seemed reasonably static regardless of activity level. Tony mentioned that he had a Blood Lactate test performed that corresponded with the BSX results, but gave no further details. Tony mentioned to me that he generally saw changes in displayed SmO2 that corresponded to intensity. He also found that he got an error if he ran at an easy pace with the BSX. Tony's review is available at [http://www.slowtwitch.com/Products/Electronics/BSX_Insight_5257.html] and was published August 2015. |
| − | * Matt completed a single test with the BSX at their facilities. Matt's review shows a plot from the BSX software that is not normally available to the end user, showing time against a relative concentration. This is intriguing, and I have similar plot from BSX for a couple of my tests. However, BSX wouldn't tell me what the substance was that they were plotting as "relative concentration". If you look at the chart on Matt's site, you'll see what is probably the raw data in red, showing a huge amount of noise, an orange line that appears to be a smoothed version, then a simple green line that is further smoothed. This is all very intriguing, but equally unclear. As an aside, Matt includes a blood lactate plot he had performed a few years back, which would not have a Lactate Threshold based on the criteria BSX uses (1+1 mmol/l rise). That's slightly ironic, but it highlights the problem with their blood testing methodology. You can read Matt's review at [ | + | * Matt completed a single test with the BSX at their facilities. Matt's review shows a plot from the BSX software that is not normally available to the end user, showing time against a relative concentration. This is intriguing, and I have similar plot from BSX for a couple of my tests. However, BSX wouldn't tell me what the substance was that they were plotting as "relative concentration". If you look at the chart on Matt's site, you'll see what is probably the raw data in red, showing a huge amount of noise, an orange line that appears to be a smoothed version, then a simple green line that is further smoothed. This is all very intriguing, but equally unclear. As an aside, Matt includes a blood lactate plot he had performed a few years back, which would not have a Lactate Threshold based on the criteria BSX uses (1+1 mmol/l rise). That's slightly ironic, but it highlights the problem with their blood testing methodology. You can read Matt's review at [http://triathletesdiary.com/blog-2/entry/general-blog-posts/playing-with-the-worlds-first-wearable-lactate-threshold-testing-device-from-bsx-athletics.html] and was published August 2015. |
| − | * Ray also completed a single test, and his write up includes the chart of blood lactate levels as well as some different charts from the BSX software. For the test Ray estimated his 10K pace as 6:05 min/mile pace, and the BSX indicated a Lactate Threshold pace of 6:03 min/mile, with the BSX blood test showing 5:42 min/mile. Ray's blog also includes a vaguely similar plot to the one Matt includes, showing noisy data in red. This chart is simply marked "estimated" on the Y axis and has a different scale with no units. This chart looks like a visual estimation of the breakpoint in the muscle oxygenation, something that other researchers have used. The review also includes some charts of probability, which is intriguing, but hard to interpret. You can read Ray's write up at [http://www.dcrainmaker.com/2014/09/bloodless-lactate-threshold.html | + | * Ray also completed a single test, and his write up includes the chart of blood lactate levels as well as some different charts from the BSX software. For the test Ray estimated his 10K pace as 6:05 min/mile pace, and the BSX indicated a Lactate Threshold pace of 6:03 min/mile, with the BSX blood test showing 5:42 min/mile. Ray's blog also includes a vaguely similar plot to the one Matt includes, showing noisy data in red. This chart is simply marked "estimated" on the Y axis and has a different scale with no units. This chart looks like a visual estimation of the breakpoint in the muscle oxygenation, something that other researchers have used. The review also includes some charts of probability, which is intriguing, but hard to interpret. You can read Ray's write up at [http://www.dcrainmaker.com/2014/09/bloodless-lactate-threshold.html]. |
| − | * Another set of reviews that BSX did not mention were performed by Gabriel Hernando of zitasport.com. Gabriel has written five articles about his experiences with BSX, mostly covering the difficulty in getting it to work. Gabriel found that the BSX gave a Lactate Threshold that compared well with his Functional Power Test from cycling. You can read Gabriel reviews at [ | + | * Another set of reviews that BSX did not mention were performed by Gabriel Hernando of zitasport.com. Gabriel has written five articles about his experiences with BSX, mostly covering the difficulty in getting it to work. Gabriel found that the BSX gave a Lactate Threshold that compared well with his Functional Power Test from cycling. You can read Gabriel reviews at [http://blog.zitasport.com/category/crowdfunding/bsx-insight/] (this is in Spanish, but Google can translate it reasonably well.) |
=BSX Gen 2 Changes= | =BSX Gen 2 Changes= | ||
The second generation of the BSX has the following changes: | The second generation of the BSX has the following changes: | ||
Latest revision as of 08:57, 23 July 2018
BSX is a simple, easy to use Running Sensor that estimates your Lactate Threshold, but I don't believe its results are correct or useful. You just wear the BSX monitor in a custom calf compression sleeve that it comes with, along with the BSX app on your phone, while running on a treadmill. The BSX app tells you what pace to run at, which increases every 3 minutes until you can't continue, at which point it (probably) tells you (it's guess at) your Lactate Threshold pace. Sadly, while the BSX simple and easy to use, the results are rather dubious and it's unclear to me if it does a better job than simply using an estimate of your 10K race pace. (This review is for the second generation BSX; for results of the first generation, see BSX Gen1.) BSX has abandoned sales of this sensor, and will decommission the cloud services in Feb 2019. However, they have released the code to their Connect IQ data field to the open source community. More at http://blog.bsxtechnologies.com/2018/02/09/bsxinsight/
Contents
1 How to use the BSX Lactate Threshold Monitor
The BSX is remarkably simple to use, especially when compared with other ways of estimating Lactate Threshold. You'll need the BSX, its calf compression sleeve, an iOS or Android device, and a treadmill.
- You'll need to have the BSX app on your iOS or Android device.
- If possible, limit the amount of ambient light. The updated BSX compression sleeve has light blocking material over the sensor, but I did have some issues using the BSX in full sunlight. This was a worst case scenario, with the intense sun directly hitting my calf due to me testing with my garage door open.
- Make sure the BSX is fully charged. (Seriously, you don't want it to run flat part way through this, so leave it charging until near the time you do the test.)
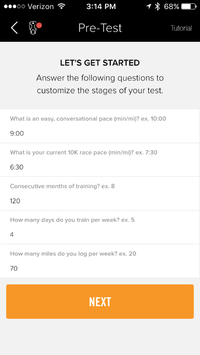
- Start the app and give it your details. It will want your conversational pace and your 10K pace, along with some other information about how long you've been running.
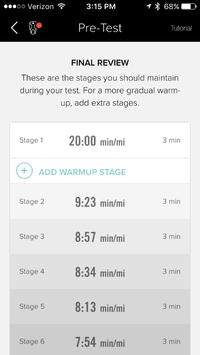
- Review the screens that tell you what paces you'll have to run. I wrote up a small card with the pace list and equivalent in MPH. I think in minutes/mile, but my treadmill works in MPH so I had to have the app set to MPH. I found it nice to know what pace I was at, as well as what the next pace would be.
- Link the app to the BSX, which normally requires the BSX and phone to be close together.
- You can link the BSX to an Ant+ heart rate monitor, but they'll have to be close to pair. The latest BSX has reduced the problems with the Ant+ communications, so you shouldn't have too many issues.
- Once you've finished pairing the BSX you can put it into the small pocket in the calf compression sleeve that is sold with the BSX. Make sure you use the BSX sleeve; it has light blocking material and a pouch to hold the sensor in place.
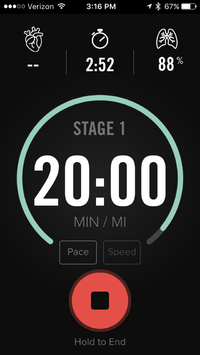
- Start the test on the app and start the treadmill. The first 3 minutes is at a walking pace, and then you'll do 3 minutes at gradually increasing paces. For instance, if you tell the BSX app that your conversational pace is 8:00 and your 10K pace is 6:30, it will give you 9:22, 8:57, 8:34, 8:13, 7:53, 7:30, 7:03, 6:40, 6:22, 6:03, 5:42, etc. (The slightly odd paces make more sense when you see them as MPH.)
- Once you've reached voluntary exhaustion, stop the treadmill and the app.
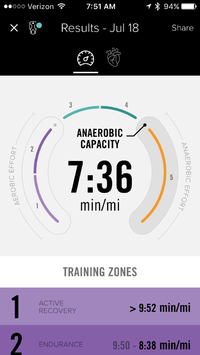
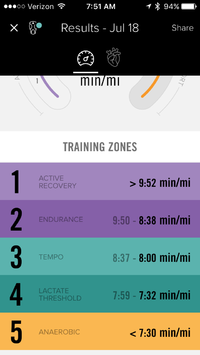
. - You'll also get suggested training paces based on the test.
- One improvement over the Gen1 version is that the update is more likely to tell you when it has no idea what your Lactate Threshold pace is. However, it still appears to be more of a wild guess.
2 Why Measure Lactate Threshold
The obvious question is why do you want to know your Lactate Threshold. There are several possible reasons.
- Tempo Runs. The common reason is to know what pace to run for Tempo Runs, also called Threshold runs because they are performed at Lactate Threshold. This is based on the idea that Lactate Threshold pace was somehow more valuable than other paces. However, the preponderance of research indicates that rather than there being special benefits to Tempo Runs, they are probably the least effective form of training.
- Race Pace Validation. If you have an accurate idea of your Lactate Threshold then you may be able to validate your target race pace. If your goal pace is faster than your Lactate Threshold indicates, then you should probably rethink your goals. On the other hand, if your Lactate Threshold is faster than you expect, then you should look for reasons why you're aiming too low.
- Evaluate Training. If you can easily monitor your Lactate Threshold you can evaluate your training progress. A good training regime should result in a faster Lactate Threshold over time, though obviously there are diminishing results as you become fitter.
3 Advantages of the BSX
- Simplicity. The BSX is vastly simpler than other methods of estimating or measuring your Lactate Threshold. There are no blood draws that accompany traditional tests, or the need to perform multiple runs on multiple days as required by the gold standards MLSS test. In addition, the BSX gives a clear and unambiguous indication of your Lactate Threshold without need for any interpretation.
- Training Intensity. The BSX sensor can be used during training to show your SmO2 value. This is a big improvement over the Gen1, which could only be used for the test.
4 Concerns with the BSX
- Validity. While the BSX gives a clear and unambiguous result, it may not be correct. See "BSX Validity" below for a list of concerns.
- Single Protocol. The BSX app supports a single protocol that uses an incremental load test with 3 minute stages. If you want to do any other test protocol, such as longer stages or something closer to the MLSS protocol, you can't.
- Single User. The BSX is sold as a single user device, and the software does not readily support sharing the device.
- Usefulness. I have two concerns around the usefulness of BSX. The first issue is that Tempo Runs don't appear to be an effective form of training, so the value of knowing your Lactate Threshold seems rather limited. However, the BSX could still be of value if it's a viable measure of training intensity, especially for High Intensity Interval Training. Typically, Heart Rate Training suffers from drift, so something more reliable might be useful. However, in my testing I found that the BSX did not seem to meaningfully reflect my training intensity. During either the BSX incremental treadmill tests or during High Intensity Interval Training the BSX showed a relatively stable Muscle Oxygen Saturation. This is in contrast with the Moxy system that showed a better relationship between intensity and Muscle Oxygen Saturation. The only noticeable change in muscle oxygenation that I saw with BSX was during the initial transition from walking to running.
5 BSX Validity
I have a number of concerns with the validity of the results of the BSX.
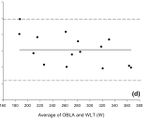
- Limited independent validation. There is a study by the University of Waikato that found a good correlation between the BSX results and some measures of Lactate Threshold. I have a number of concerns with this study. It used the first generation of BSX which has some rather obvious failings, and it does not compare the BSX against a good reference standard for Lactate Threshold (MLSS). The study used three estimates of Lactate Threshold based on blood lactate testing; one is the common Onset of Blood Lactate Accumulation (OBLA), but the other two were somewhat unusual. They found that the BSX was +/- 19 watts of OBLA, itself not a great measure of Lactate Threshold. So, the Gen 1 BSX showed a better correlation with a bad standard than research shows between those standards and the true Lactate Threshold (MLSS). The main conclusion I would draw from this study is that a crude estimate of LT from 10K pace is just as good as the crude estimates from an incremental stress test with blood lactate draws.
- Black Box. The BSX algorithm is proprietary and not clearly documented, which means it's hard to know if there is any scientific basis for their approach. BSX states that their algorithm is patented, but nowhere do they indicate what their patent number is. I believe it is patent US20130096403; see below for details.
- BSX Validation. BSX has performed their own validation but the results are not published. The reviews give some insight into the methodology that BSX uses, but the details are unclear. These reviews indicate that BSX did not use the gold standard of MLSS for Lactate Threshold in their validation. Instead they used an incremental treadmill test with lactate measurement from a blood draw, and relied on the rather poor Carmichael Training Systems determination of Lactate Threshold. I believe that this indicates that BSX has performed their internal validation against a seriously flawed baseline. (See Lactate Threshold for details.)
- 3 Minute Stages. The BSX protocol uses an incremental test with three minute stages, which does not appear to be a valid approach for measuring blood lactate directly. This is because blood lactate takes 20-30 minutes to stabilize for a given intensity. Of course, it is possible that muscle oxygenation would not be subject to this limitation as it is measuring a very different physiological parameter, but it is another concern.
- %O2 Measurement. In my testing, the BSX measured a constant oxygen saturation level regardless of exercise intensity. This is in contrast to Moxy that showed a decline in oxygen saturation with increasing exercise intensity, roughly in line with the published literature. BSX has suggested that future versions of their software will present a more realistic estimate of oxygen saturation, and this problem should not indicate an issue with their validity. Personally, I find this a lack of even a relative change in oxygen saturation rather troubling. (The second generation BSX is exhibiting similar measurements to the first generation.)
- Invalid Results. In my personal testing, the results of the BSX did not seem valid, but seemed to be based on what I told the application was my 10K pace combined with the pace at which I terminated the test.
- Tell BSX my 10K pace was 8:00 and terminating at 7:54 gives an LT pace of 8:17
- Tell BSX my 10K pace was 7:30 and terminating at 7:04 gives an LT pace of 7:36
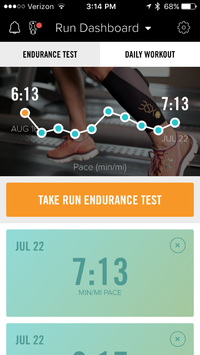
- Tell BSX my 10K pace was 6:30 and terminating at 6:23 gives an LT pace of 7:13
- Sensor Location. A minor concern is the location of the sensor on the calf, where it may be more affected by changes in biomechanics than using the quads.
6 Testing BSX
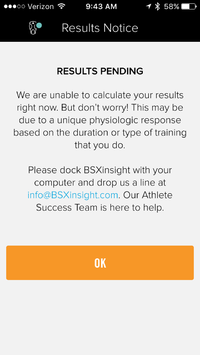
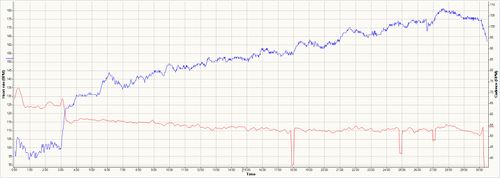
I performed a number of tests of the BSX. Other than a few tests when I had an issue with excessive ambient light, the BSX always provided me with an estimate of my Lactate Threshold. The answer it gave depended directly on the input I gave the app about my 10K pace. As noted above, the estimate would vary wildly. Below is the data I captured from one of the tests. You can see the sudden rise in heart rate at the three minute mark that represents the end of the initial walk and the beginning of the running, and this is followed by a steady rise in heart rate. The red line represents the muscle oxygen saturation recorded by the BSX, and you can see that it detects the change from walking to running with a small drop, but thereafter remains relatively level. There is a slight drop from the first running section through to about the 15 minute mark, after which it levels off. You see a few small dropouts, but this might be an issue with the communications from the BSX to my watch. It's hard to see from this muscle oxygenation data that there is any indication of a change that would represent a lactate threshold. In fact it's hard to believe that the BSX is even really determining muscle oxygenation. (Note: the muscle oxygenation data is recorded as cadence data for compatibility.)
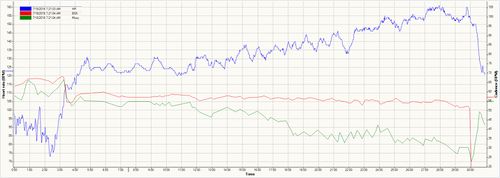
I did all my tests with both the BSX and the Moxy for comparison. Unfortunately, I had a battery problem with my Moxy so I don't have as many samples to show. The image below shows the rising heart rate in blue, the BSX in red, and the Moxy in green. You can see that both the BSX and the Moxy drop as I transition from walking to running, but you'll notice that the Moxy continues to drop as the intensity increases. This is what I'd expect to see from a muscle oxygenation sensor. In my testing I've always seen the Moxy detect a drop in muscle oxygenation, and never seen one from any of my BSX sensors. I have no way of verifying whether the Moxy is accurate, but I can see that it is the least functioning.
7 Patent US20130096403
Patent US20130096403 A1 (Apparatus and method for improving training threshold), which is a patent for determining the Lactate Threshold using an incremental stress test with an infrared sensor. I feel reasonably confident that this is the BSX patent, but I could not confirm this and BSX seem to carefully avoid any reference to the details of their patent. The patent describes an experiment using a 3 minute incremental treadmill run on 34 subjects, which looks like multiple aspects of muscle oxygenation (SmO2):
- SmO2. The basic measure of SmO2 showed a good correlation between SmO2 and Lactate, but only in 19 of 34 subjects (56%). The example correlation uses Lactate ranges 0.6 to 2.5, suggesting that the correlation might only exist at relatively low intensities.
- Rate of change of SmO2. This is the slope of the line drawn through the SmO2 during a stage. Here the correlation existed only for 11 of the 34 subjects (32%). Here the chart shoes a Lactate range of 1.2 to 6.8, which is a much higher intensity and crosses what BSX consider to be the marker for Lactate Threshold (even though there is a fairly linear increase up to the 6.8 mark.)
- Magnitude of the reduction in SmO2. It looks like they do an exponential fit for the SmO2 and then find the rate of decay constant. This gives a correlation for 25 of the 34 subjects (73%). Here the charts are rather odd; the increment test chart shows Lactate in the range 0.6 to 2.0, but the regression chart only uses value of 0.6 to 1.3 (pretty much resting Lactate levels).
- Rate of decay of SmO2. Like the magnitude, this uses the rate of decay from the exponential fit, but this only gives a correlation for 9 of the 34 subjects (26%). The charts for this have a Lactate range of 0.8 to 4.0, a reasonable range for a Lactate Threshold test.
Overall, 32 of the 34 had a correlation for one of the variables, but the patent does not suggest a way of determining which variable to use for a given subject. The patent proposes creating a model with a regression constant for each four variables, but the overall correlation for such a model is not shown. Given that the correlations are not shown for the full range of Lactate values seems odd to say the least.
8 Independent Reviews
BSX pointed me to three individuals who have reviewed their device; Tony Vienneau (Slowtwitch.com), Matt Fisher (triathletesdiary.com), and Ray Maker (dcrainmaker.com).
- Tony's review on slowtwitch.com mentioned that he used the BSX to perform multiple tests (30-40). Tony noted that the muscle oxygenation value displayed on the BSX varied with fatigue, which was different to my results where the value seemed reasonably static regardless of activity level. Tony mentioned that he had a Blood Lactate test performed that corresponded with the BSX results, but gave no further details. Tony mentioned to me that he generally saw changes in displayed SmO2 that corresponded to intensity. He also found that he got an error if he ran at an easy pace with the BSX. Tony's review is available at [1] and was published August 2015.
- Matt completed a single test with the BSX at their facilities. Matt's review shows a plot from the BSX software that is not normally available to the end user, showing time against a relative concentration. This is intriguing, and I have similar plot from BSX for a couple of my tests. However, BSX wouldn't tell me what the substance was that they were plotting as "relative concentration". If you look at the chart on Matt's site, you'll see what is probably the raw data in red, showing a huge amount of noise, an orange line that appears to be a smoothed version, then a simple green line that is further smoothed. This is all very intriguing, but equally unclear. As an aside, Matt includes a blood lactate plot he had performed a few years back, which would not have a Lactate Threshold based on the criteria BSX uses (1+1 mmol/l rise). That's slightly ironic, but it highlights the problem with their blood testing methodology. You can read Matt's review at [2] and was published August 2015.
- Ray also completed a single test, and his write up includes the chart of blood lactate levels as well as some different charts from the BSX software. For the test Ray estimated his 10K pace as 6:05 min/mile pace, and the BSX indicated a Lactate Threshold pace of 6:03 min/mile, with the BSX blood test showing 5:42 min/mile. Ray's blog also includes a vaguely similar plot to the one Matt includes, showing noisy data in red. This chart is simply marked "estimated" on the Y axis and has a different scale with no units. This chart looks like a visual estimation of the breakpoint in the muscle oxygenation, something that other researchers have used. The review also includes some charts of probability, which is intriguing, but hard to interpret. You can read Ray's write up at [3].
- Another set of reviews that BSX did not mention were performed by Gabriel Hernando of zitasport.com. Gabriel has written five articles about his experiences with BSX, mostly covering the difficulty in getting it to work. Gabriel found that the BSX gave a Lactate Threshold that compared well with his Functional Power Test from cycling. You can read Gabriel reviews at [4] (this is in Spanish, but Google can translate it reasonably well.)
9 BSX Gen 2 Changes
The second generation of the BSX has the following changes:
- New hardware, not just a software upgrade. The two units look virtually identical on the outside, but I assume there is internal changes.
- Improved ANT+ and BLE connectivity. This does seem to have improved quite a bit.
- Real-time muscle oxygenation recording.
- Improved graphs and overhauled design experience. I'd say this was only a minor improvement.
- Automated KICKR integration. This is a cycling feature, so I didn't test this.
- Full download of all workout files. I couldn't see how to do this, but it's not a big deal given you can record your workout with an Ant+ compatible watch.
- ANT+ broadcasting to watches and head units. This allows you to record the muscle oxygenation on most Ant+ compatible watches.
- Improved light blocking in the compression sleeve. This is probably quite a big deal, and you should always use the compression sleeve that comes with the BSX.
