Difference between revisions of "GPS Accuracy"
User:Fellrnr (User talk:Fellrnr | contribs) |
User:Fellrnr (User talk:Fellrnr | contribs) |
||
| Line 1: | Line 1: | ||
| − | I evaluated the real world accuracy of GPS watches while running over | + | I evaluated the real world accuracy of GPS watches while running over 2,500 miles/4,000Km and recording over 10,000 data points as part of my evaluation of the [[Best Running Watch]]es. Under good conditions the watches are all remarkably good, but when things get a little tough the differences become more apparent. The table below is a vastly simplified summary of the results, rating the best device as a 10 then comparing the others. (Note that '10' does not indicate perfect, just the best I've measured so far.) |
{| class="wikitable" | {| class="wikitable" | ||
! Device | ! Device | ||
Revision as of 16:07, 22 January 2014
I evaluated the real world accuracy of GPS watches while running over 2,500 miles/4,000Km and recording over 10,000 data points as part of my evaluation of the Best Running Watches. Under good conditions the watches are all remarkably good, but when things get a little tough the differences become more apparent. The table below is a vastly simplified summary of the results, rating the best device as a 10 then comparing the others. (Note that '10' does not indicate perfect, just the best I've measured so far.)
| Device | Trueness | Precision | Overall |
|---|---|---|---|
| Garmin 205 | 10.0 | 10.0 | 10.0 |
| Garmin 910XT with Footpod | 7.4 | 9.8 | 9.0 |
| Garmin 310XT with Footpod | 5.8 | 9.1 | 7.9 |
| iPhone 4s | 4.4 | 9.6 | 7.2 |
| Garmin 310XT no Footpod | 4.9 | 8.1 | 6.8 |
| Polar RC3 GPS | 5.7 | 6.9 | 6.5 |
Contents
1 Methodology
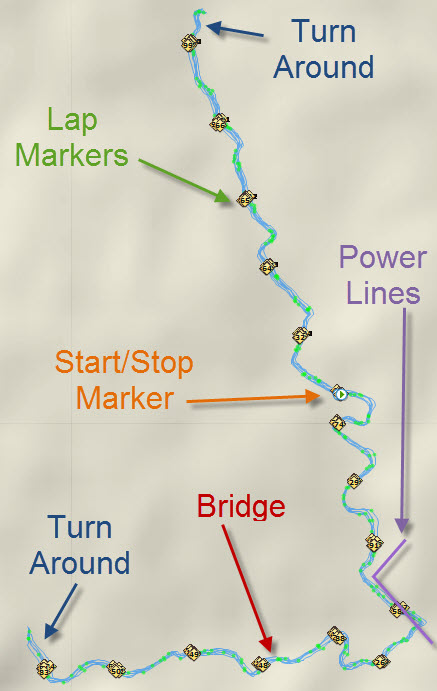
Simply taking a GPS watch on a single run does not provide sufficient data to reasonably evaluate its accuracy. So to gather the data for this test I marked my usual running route at quarter-mile intervals, using a Jones counter to provide an accurate measure of distance. The Jones counter is the device used to certify courses, and I followed the USATF course certification process. The course I run along is a little challenging for GPS, with lots of twists, tree cover, power lines, and one bridge that I go under. The bridge carries a 4 lane road, so it's wide enough to cause the watches to briefly loose GPS signal. However, I believe that it's reasonably representative of real-world conditions, and probably less challenging than running in the city with skyscrapers. At both ends of the course there is a turnaround, and I set the mark an eighth of a mile from the end. That way I can evaluate how well the watches handle an about turn.
2 Accuracy, Trueness and Precision
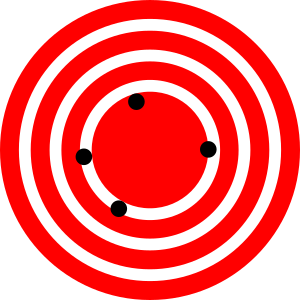
For this evaluation I'll use the definition of Accuracy as the combination of trueness and precision:
We can look at trueness by measuring the average lap length and precision by measuring the standard deviation.
3 Accuracy
I've divided the laps into those that go under the bridge, those that are immediately after a lap that goes under the bridge, those that go next to or under the power lines, those that turn around and then all the rest (normal). I've also included a 'mixed' category that reflects all the sections.
3.1 Accuracy by Condition then Device
| Condition | Device | Count | Trueness (Average Distance Error) | 95% within | Standard Deviation |
|---|---|---|---|---|---|
|
Normal |
Garmin 205 | 779 |
0.014% (72.9 Ft/Mile 13.8 m/Km) |
0.063 (331.2 Ft/Mile 62.7 m/Km) |
0.031 (165.6 Ft/Mile 31.4 m/Km) |
| iPhone 4s | 668 |
0.030% (160.8 Ft/Mile 30.5 m/Km) |
0.070 (372.0 Ft/Mile 70.5 m/Km) |
0.035 (186.0 Ft/Mile 35.2 m/Km) | |
| Polar RC3 GPS | 983 |
0.015% (79.8 Ft/Mile 15.1 m/Km) |
0.082 (434.7 Ft/Mile 82.3 m/Km) |
0.041 (217.4 Ft/Mile 41.2 m/Km) | |
| Garmin 310XT with Footpod | 2787 |
0.020% (105.5 Ft/Mile 20.0 m/Km) |
0.073 (384.7 Ft/Mile 72.9 m/Km) |
0.036 (192.3 Ft/Mile 36.4 m/Km) | |
| Garmin 310XT no Footpod | 1210 |
0.025% (134.6 Ft/Mile 25.5 m/Km) |
0.083 (439.4 Ft/Mile 83.2 m/Km) |
0.042 (219.7 Ft/Mile 41.6 m/Km) | |
| Garmin 910XT with Footpod | 514 |
0.014% (75.4 Ft/Mile 14.3 m/Km) |
0.059 (311.5 Ft/Mile 59.0 m/Km) |
0.030 (155.8 Ft/Mile 29.5 m/Km) | |
| All | 6941 |
0.020% (106.4 Ft/Mile 20.1 m/Km) |
0.075 (394.4 Ft/Mile 74.7 m/Km) |
0.037 (197.2 Ft/Mile 37.3 m/Km) | |
|
Under Bridge |
Garmin 205 | 66 |
-0.014% (72.8 Ft/Mile 13.8 m/Km) |
0.148 (780.4 Ft/Mile 147.8 m/Km) |
0.074 (390.2 Ft/Mile 73.9 m/Km) |
| iPhone 4s | 59 |
0.014% (74.0 Ft/Mile 14.0 m/Km) |
0.067 (356.1 Ft/Mile 67.4 m/Km) |
0.034 (178.0 Ft/Mile 33.7 m/Km) | |
| Polar RC3 GPS | 86 |
0.056% (296.3 Ft/Mile 56.1 m/Km) |
0.156 (825.3 Ft/Mile 156.3 m/Km) |
0.078 (412.7 Ft/Mile 78.2 m/Km) | |
| Garmin 310XT with Footpod | 222 |
0.032% (168.6 Ft/Mile 31.9 m/Km) |
0.098 (520.0 Ft/Mile 98.5 m/Km) |
0.049 (260.0 Ft/Mile 49.2 m/Km) | |
| Garmin 310XT no Footpod | 99 |
0.007% (35.3 Ft/Mile 6.7 m/Km) |
0.084 (446.0 Ft/Mile 84.5 m/Km) |
0.042 (223.0 Ft/Mile 42.2 m/Km) | |
| Garmin 910XT with Footpod | 43 |
0.016% (86.1 Ft/Mile 16.3 m/Km) |
0.168 (889.0 Ft/Mile 168.4 m/Km) |
0.084 (444.5 Ft/Mile 84.2 m/Km) | |
| All | 575 |
0.023% (121.2 Ft/Mile 22.9 m/Km) |
0.124 (654.2 Ft/Mile 123.9 m/Km) |
0.062 (327.1 Ft/Mile 62.0 m/Km) | |
|
Post Bridge |
Garmin 205 | 66 |
0.022% (113.9 Ft/Mile 21.6 m/Km) |
0.048 (250.9 Ft/Mile 47.5 m/Km) |
0.024 (125.5 Ft/Mile 23.8 m/Km) |
| iPhone 4s | 54 |
0.044% (233.5 Ft/Mile 44.2 m/Km) |
0.060 (314.9 Ft/Mile 59.6 m/Km) |
0.030 (157.4 Ft/Mile 29.8 m/Km) | |
| Polar RC3 GPS | 84 |
0.074% (390.7 Ft/Mile 74.0 m/Km) |
0.100 (526.4 Ft/Mile 99.7 m/Km) |
0.050 (263.2 Ft/Mile 49.8 m/Km) | |
| Garmin 310XT with Footpod | 188 |
0.041% (216.2 Ft/Mile 41.0 m/Km) |
0.075 (394.8 Ft/Mile 74.8 m/Km) |
0.037 (197.4 Ft/Mile 37.4 m/Km) | |
| Garmin 310XT no Footpod | 95 |
0.051% (268.6 Ft/Mile 50.9 m/Km) |
0.074 (388.5 Ft/Mile 73.6 m/Km) |
0.037 (194.3 Ft/Mile 36.8 m/Km) | |
| Garmin 910XT with Footpod | 40 |
0.043% (229.1 Ft/Mile 43.4 m/Km) |
0.043 (226.4 Ft/Mile 42.9 m/Km) |
0.021 (113.2 Ft/Mile 21.4 m/Km) | |
| All | 527 |
0.046% (243.4 Ft/Mile 46.1 m/Km) |
0.079 (415.6 Ft/Mile 78.7 m/Km) |
0.039 (207.8 Ft/Mile 39.4 m/Km) | |
|
Turn Around |
Garmin 205 | 72 |
0.036% (192.5 Ft/Mile 36.5 m/Km) |
0.052 (273.9 Ft/Mile 51.9 m/Km) |
0.026 (136.9 Ft/Mile 25.9 m/Km) |
| iPhone 4s | 62 |
0.066% (349.7 Ft/Mile 66.2 m/Km) |
0.089 (471.3 Ft/Mile 89.3 m/Km) |
0.045 (235.6 Ft/Mile 44.6 m/Km) | |
| Polar RC3 GPS | 92 |
0.065% (341.7 Ft/Mile 64.7 m/Km) |
0.154 (814.6 Ft/Mile 154.3 m/Km) |
0.077 (407.3 Ft/Mile 77.1 m/Km) | |
| Garmin 310XT with Footpod | 205 |
0.056% (294.2 Ft/Mile 55.7 m/Km) |
0.083 (439.2 Ft/Mile 83.2 m/Km) |
0.042 (219.6 Ft/Mile 41.6 m/Km) | |
| Garmin 310XT no Footpod | 107 |
0.059% (311.8 Ft/Mile 59.1 m/Km) |
0.115 (605.8 Ft/Mile 114.7 m/Km) |
0.057 (302.9 Ft/Mile 57.4 m/Km) | |
| Garmin 910XT with Footpod | 43 |
0.051% (270.2 Ft/Mile 51.2 m/Km) |
0.051 (270.7 Ft/Mile 51.3 m/Km) |
0.026 (135.3 Ft/Mile 25.6 m/Km) | |
| All | 581 |
0.056% (296.5 Ft/Mile 56.2 m/Km) |
0.102 (536.1 Ft/Mile 101.5 m/Km) |
0.051 (268.0 Ft/Mile 50.8 m/Km) | |
|
Power Line |
Garmin 205 | 127 |
0.014% (73.7 Ft/Mile 14.0 m/Km) |
0.046 (245.1 Ft/Mile 46.4 m/Km) |
0.023 (122.5 Ft/Mile 23.2 m/Km) |
| iPhone 4s | 110 |
0.026% (135.2 Ft/Mile 25.6 m/Km) |
0.058 (305.3 Ft/Mile 57.8 m/Km) |
0.029 (152.7 Ft/Mile 28.9 m/Km) | |
| Polar RC3 GPS | 167 |
0.020% (107.2 Ft/Mile 20.3 m/Km) |
0.072 (377.7 Ft/Mile 71.5 m/Km) |
0.036 (188.8 Ft/Mile 35.8 m/Km) | |
| Garmin 310XT with Footpod | 515 |
0.026% (135.5 Ft/Mile 25.7 m/Km) |
0.069 (366.5 Ft/Mile 69.4 m/Km) |
0.035 (183.2 Ft/Mile 34.7 m/Km) | |
| Garmin 310XT no Footpod | 203 |
0.034% (179.0 Ft/Mile 33.9 m/Km) |
0.072 (377.9 Ft/Mile 71.6 m/Km) |
0.036 (188.9 Ft/Mile 35.8 m/Km) | |
| Garmin 910XT with Footpod | 90 |
0.021% (110.9 Ft/Mile 21.0 m/Km) |
0.048 (254.4 Ft/Mile 48.2 m/Km) |
0.024 (127.2 Ft/Mile 24.1 m/Km) | |
| All | 1212 |
0.025% (130.5 Ft/Mile 24.7 m/Km) |
0.067 (351.5 Ft/Mile 66.6 m/Km) |
0.033 (175.8 Ft/Mile 33.3 m/Km) | |
|
Mixed |
Garmin 205 | 1110 |
0.014% (74.5 Ft/Mile 14.1 m/Km) |
0.070 (371.2 Ft/Mile 70.3 m/Km) |
0.035 (185.6 Ft/Mile 35.2 m/Km) |
| iPhone 4s | 953 |
0.032% (168.9 Ft/Mile 32.0 m/Km) |
0.073 (384.8 Ft/Mile 72.9 m/Km) |
0.036 (192.4 Ft/Mile 36.4 m/Km) | |
| Polar RC3 GPS | 1412 |
0.025% (131.8 Ft/Mile 25.0 m/Km) |
0.102 (539.9 Ft/Mile 102.3 m/Km) |
0.051 (269.9 Ft/Mile 51.1 m/Km) | |
| Garmin 310XT with Footpod | 3917 |
0.024% (128.2 Ft/Mile 24.3 m/Km) |
0.077 (406.2 Ft/Mile 76.9 m/Km) |
0.038 (203.1 Ft/Mile 38.5 m/Km) | |
| Garmin 310XT no Footpod | 1714 |
0.029% (152.6 Ft/Mile 28.9 m/Km) |
0.087 (457.9 Ft/Mile 86.7 m/Km) |
0.043 (229.0 Ft/Mile 43.4 m/Km) | |
| Garmin 910XT with Footpod | 730 |
0.019% (100.3 Ft/Mile 19.0 m/Km) |
0.071 (377.2 Ft/Mile 71.4 m/Km) |
0.036 (188.6 Ft/Mile 35.7 m/Km) | |
| All | 9836 |
0.024% (128.8 Ft/Mile 24.4 m/Km) |
0.082 (432.6 Ft/Mile 81.9 m/Km) |
0.041 (216.3 Ft/Mile 41.0 m/Km) |
3.2 Accuracy by Device then Condition
| Device | Condition | Count | 95% within | Trueness (Average Distance Error) | 95% within | Standard Deviation |
|---|---|---|---|---|---|---|
|
Garmin 205 |
Normal | 779 | 0.063 (331.2 Ft/Mile 62.7 m/Km) |
0.014% (72.9 Ft/Mile 13.8 m/Km) |
0.063 (331.2 Ft/Mile 62.7 m/Km) |
0.031 (165.6 Ft/Mile 31.4 m/Km) |
| Under Bridge | 66 | 0.148 (780.4 Ft/Mile 147.8 m/Km) |
-0.014% (72.8 Ft/Mile 13.8 m/Km) |
0.148 (780.4 Ft/Mile 147.8 m/Km) |
0.074 (390.2 Ft/Mile 73.9 m/Km) | |
| Post Bridge | 66 | 0.048 (250.9 Ft/Mile 47.5 m/Km) |
0.022% (113.9 Ft/Mile 21.6 m/Km) |
0.048 (250.9 Ft/Mile 47.5 m/Km) |
0.024 (125.5 Ft/Mile 23.8 m/Km) | |
| Turn Around | 72 | 0.052 (273.9 Ft/Mile 51.9 m/Km) |
0.036% (192.5 Ft/Mile 36.5 m/Km) |
0.052 (273.9 Ft/Mile 51.9 m/Km) |
0.026 (136.9 Ft/Mile 25.9 m/Km) | |
| Power Line | 127 | 0.046 (245.1 Ft/Mile 46.4 m/Km) |
0.014% (73.7 Ft/Mile 14.0 m/Km) |
0.046 (245.1 Ft/Mile 46.4 m/Km) |
0.023 (122.5 Ft/Mile 23.2 m/Km) | |
| Mixed | 1110 | 0.070 (371.2 Ft/Mile 70.3 m/Km) |
0.014% (74.5 Ft/Mile 14.1 m/Km) |
0.070 (371.2 Ft/Mile 70.3 m/Km) |
0.035 (185.6 Ft/Mile 35.2 m/Km) | |
|
iPhone 4s |
Normal | 668 | 0.070 (372.0 Ft/Mile 70.5 m/Km) |
0.030% (160.8 Ft/Mile 30.5 m/Km) |
0.070 (372.0 Ft/Mile 70.5 m/Km) |
0.035 (186.0 Ft/Mile 35.2 m/Km) |
| Under Bridge | 59 | 0.067 (356.1 Ft/Mile 67.4 m/Km) |
0.014% (74.0 Ft/Mile 14.0 m/Km) |
0.067 (356.1 Ft/Mile 67.4 m/Km) |
0.034 (178.0 Ft/Mile 33.7 m/Km) | |
| Post Bridge | 54 | 0.060 (314.9 Ft/Mile 59.6 m/Km) |
0.044% (233.5 Ft/Mile 44.2 m/Km) |
0.060 (314.9 Ft/Mile 59.6 m/Km) |
0.030 (157.4 Ft/Mile 29.8 m/Km) | |
| Turn Around | 62 | 0.089 (471.3 Ft/Mile 89.3 m/Km) |
0.066% (349.7 Ft/Mile 66.2 m/Km) |
0.089 (471.3 Ft/Mile 89.3 m/Km) |
0.045 (235.6 Ft/Mile 44.6 m/Km) | |
| Power Line | 110 | 0.058 (305.3 Ft/Mile 57.8 m/Km) |
0.026% (135.2 Ft/Mile 25.6 m/Km) |
0.058 (305.3 Ft/Mile 57.8 m/Km) |
0.029 (152.7 Ft/Mile 28.9 m/Km) | |
| Mixed | 953 | 0.073 (384.8 Ft/Mile 72.9 m/Km) |
0.032% (168.9 Ft/Mile 32.0 m/Km) |
0.073 (384.8 Ft/Mile 72.9 m/Km) |
0.036 (192.4 Ft/Mile 36.4 m/Km) | |
| Normal | 983 | 0.082 (434.7 Ft/Mile 82.3 m/Km) |
0.015% (79.8 Ft/Mile 15.1 m/Km) |
0.082 (434.7 Ft/Mile 82.3 m/Km) |
0.041 (217.4 Ft/Mile 41.2 m/Km) | |
| Under Bridge | 86 | 0.156 (825.3 Ft/Mile 156.3 m/Km) |
0.056% (296.3 Ft/Mile 56.1 m/Km) |
0.156 (825.3 Ft/Mile 156.3 m/Km) |
0.078 (412.7 Ft/Mile 78.2 m/Km) | |
| Post Bridge | 84 | 0.100 (526.4 Ft/Mile 99.7 m/Km) |
0.074% (390.7 Ft/Mile 74.0 m/Km) |
0.100 (526.4 Ft/Mile 99.7 m/Km) |
0.050 (263.2 Ft/Mile 49.8 m/Km) | |
| Turn Around | 92 | 0.154 (814.6 Ft/Mile 154.3 m/Km) |
0.065% (341.7 Ft/Mile 64.7 m/Km) |
0.154 (814.6 Ft/Mile 154.3 m/Km) |
0.077 (407.3 Ft/Mile 77.1 m/Km) | |
| Power Line | 167 | 0.072 (377.7 Ft/Mile 71.5 m/Km) |
0.020% (107.2 Ft/Mile 20.3 m/Km) |
0.072 (377.7 Ft/Mile 71.5 m/Km) |
0.036 (188.8 Ft/Mile 35.8 m/Km) | |
| Mixed | 1412 | 0.102 (539.9 Ft/Mile 102.3 m/Km) |
0.025% (131.8 Ft/Mile 25.0 m/Km) |
0.102 (539.9 Ft/Mile 102.3 m/Km) |
0.051 (269.9 Ft/Mile 51.1 m/Km) | |
|
Garmin 310XT with Footpod |
Normal | 2787 | 0.073 (384.7 Ft/Mile 72.9 m/Km) |
0.020% (105.5 Ft/Mile 20.0 m/Km) |
0.073 (384.7 Ft/Mile 72.9 m/Km) |
0.036 (192.3 Ft/Mile 36.4 m/Km) |
| Under Bridge | 222 | 0.098 (520.0 Ft/Mile 98.5 m/Km) |
0.032% (168.6 Ft/Mile 31.9 m/Km) |
0.098 (520.0 Ft/Mile 98.5 m/Km) |
0.049 (260.0 Ft/Mile 49.2 m/Km) | |
| Post Bridge | 188 | 0.075 (394.8 Ft/Mile 74.8 m/Km) |
0.041% (216.2 Ft/Mile 41.0 m/Km) |
0.075 (394.8 Ft/Mile 74.8 m/Km) |
0.037 (197.4 Ft/Mile 37.4 m/Km) | |
| Turn Around | 205 | 0.083 (439.2 Ft/Mile 83.2 m/Km) |
0.056% (294.2 Ft/Mile 55.7 m/Km) |
0.083 (439.2 Ft/Mile 83.2 m/Km) |
0.042 (219.6 Ft/Mile 41.6 m/Km) | |
| Power Line | 515 | 0.069 (366.5 Ft/Mile 69.4 m/Km) |
0.026% (135.5 Ft/Mile 25.7 m/Km) |
0.069 (366.5 Ft/Mile 69.4 m/Km) |
0.035 (183.2 Ft/Mile 34.7 m/Km) | |
| Mixed | 3917 | 0.077 (406.2 Ft/Mile 76.9 m/Km) |
0.024% (128.2 Ft/Mile 24.3 m/Km) |
0.077 (406.2 Ft/Mile 76.9 m/Km) |
0.038 (203.1 Ft/Mile 38.5 m/Km) | |
| Normal | 1210 | 0.083 (439.4 Ft/Mile 83.2 m/Km) |
0.025% (134.6 Ft/Mile 25.5 m/Km) |
0.083 (439.4 Ft/Mile 83.2 m/Km) |
0.042 (219.7 Ft/Mile 41.6 m/Km) | |
| Under Bridge | 99 | 0.084 (446.0 Ft/Mile 84.5 m/Km) |
0.007% (35.3 Ft/Mile 6.7 m/Km) |
0.084 (446.0 Ft/Mile 84.5 m/Km) |
0.042 (223.0 Ft/Mile 42.2 m/Km) | |
| Post Bridge | 95 | 0.074 (388.5 Ft/Mile 73.6 m/Km) |
0.051% (268.6 Ft/Mile 50.9 m/Km) |
0.074 (388.5 Ft/Mile 73.6 m/Km) |
0.037 (194.3 Ft/Mile 36.8 m/Km) | |
| Turn Around | 107 | 0.115 (605.8 Ft/Mile 114.7 m/Km) |
0.059% (311.8 Ft/Mile 59.1 m/Km) |
0.115 (605.8 Ft/Mile 114.7 m/Km) |
0.057 (302.9 Ft/Mile 57.4 m/Km) | |
| Power Line | 203 | 0.072 (377.9 Ft/Mile 71.6 m/Km) |
0.034% (179.0 Ft/Mile 33.9 m/Km) |
0.072 (377.9 Ft/Mile 71.6 m/Km) |
0.036 (188.9 Ft/Mile 35.8 m/Km) | |
| Mixed | 1714 | 0.087 (457.9 Ft/Mile 86.7 m/Km) |
0.029% (152.6 Ft/Mile 28.9 m/Km) |
0.087 (457.9 Ft/Mile 86.7 m/Km) |
0.043 (229.0 Ft/Mile 43.4 m/Km) | |
|
Garmin 910XT with Footpod |
Normal | 514 | 0.059 (311.5 Ft/Mile 59.0 m/Km) |
0.014% (75.4 Ft/Mile 14.3 m/Km) |
0.059 (311.5 Ft/Mile 59.0 m/Km) |
0.030 (155.8 Ft/Mile 29.5 m/Km) |
| Under Bridge | 43 | 0.168 (889.0 Ft/Mile 168.4 m/Km) |
0.016% (86.1 Ft/Mile 16.3 m/Km) |
0.168 (889.0 Ft/Mile 168.4 m/Km) |
0.084 (444.5 Ft/Mile 84.2 m/Km) | |
| Post Bridge | 40 | 0.043 (226.4 Ft/Mile 42.9 m/Km) |
0.043% (229.1 Ft/Mile 43.4 m/Km) |
0.043 (226.4 Ft/Mile 42.9 m/Km) |
0.021 (113.2 Ft/Mile 21.4 m/Km) | |
| Turn Around | 43 | 0.051 (270.7 Ft/Mile 51.3 m/Km) |
0.051% (270.2 Ft/Mile 51.2 m/Km) |
0.051 (270.7 Ft/Mile 51.3 m/Km) |
0.026 (135.3 Ft/Mile 25.6 m/Km) | |
| Power Line | 90 | 0.048 (254.4 Ft/Mile 48.2 m/Km) |
0.021% (110.9 Ft/Mile 21.0 m/Km) |
0.048 (254.4 Ft/Mile 48.2 m/Km) |
0.024 (127.2 Ft/Mile 24.1 m/Km) | |
| Mixed | 730 | 0.071 (377.2 Ft/Mile 71.4 m/Km) |
0.019% (100.3 Ft/Mile 19.0 m/Km) |
0.071 (377.2 Ft/Mile 71.4 m/Km) |
0.036 (188.6 Ft/Mile 35.7 m/Km) |
3.3 Interpretation
What do these statistics mean? This is my interpretation:
- Under normal conditions the GPS accuracy is quite good for all devices.
- Not surprisingly, accuracy drops going under the bridge.
- More interestingly the trueness just after the bridge is even lower, suggesting that the GPS watches are struggling to reacquire the satellites.
- The turnarounds are even less accurate than going under a bridge, but Power Lines do not seem to impact accuracy noticeably.
- The Footpod improves the accuracy of the 310XT.
- Note that I'm intentionally using an uncalibrated Footpod (factor = 1.000) to gather data for a comparison of Foodpod and GPS.
- The Garmin 205 does remarkably well, especially for an older device.
- Without the Footpod, the 310XT has similar problems to the RC3 on the turn around, but the RC3 does quite a bit worse under the bridge.
4 Recommendations
Here are some recommendations for GPS watches.
- GPS watches are accurate enough for most general running.
- Adding a Footpod to the Garmin 310XT improves its accuracy.
- It takes time for the GPS watches to acquire the satellites. Some watches tended to say they are ready to go before they have an optimal lock. Therefore, to improve accuracy try to give them a little more time. Note that some newer GPS watches such as the Garmin 620 have the ability to be preloaded with the satellite positions, reducing this startup time and start up in accuracy dramatically.
- The GPS watches are not accurate enough to perform any type of interval training. Instead, use a track or measure out the distance using some other mechanism.
- GPS is not accurate enough to give a good reading of current pace.
5 Even GPS Watches have Bad Days
While it's tempting to take the various GPS watches on a single run and simply compare the totals, this is a flawed approach. Evaluating the devices GPS accuracy on the basis of a single sample does not tell you much. It's a bit like evaluating an athlete's ability on the basis of one event; everyone has good days and bad days, and that applies to GPS watches as well. To illustrate this, the images below are from two runs, recorded on 9/20 and 9/22. In each run I recorded data on both the 310 and 910 watches, hitting the lap button on both at as close to the same time as is humanly possible. On 9/20 the 910XT was far more accurate than the 310XT, but on 9/22 the situation is reversed. If you were to have evaluated the two watches on the basis of a single run, you would conclude that one is much better than the other. But which device would win would depend on the particular day. This is why I've accumulated a lot of data to do a statistical analysis to work out which is really better.
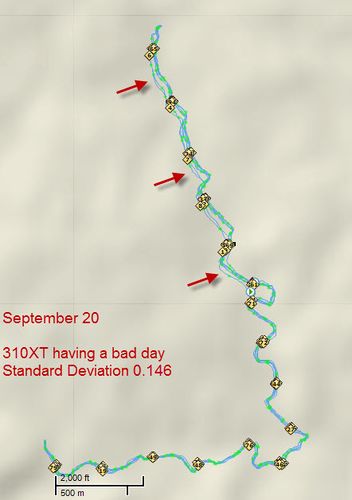 The Garmin 310XT having a bad day. You can see on the upper half of the course where it got a little confused and off track. |
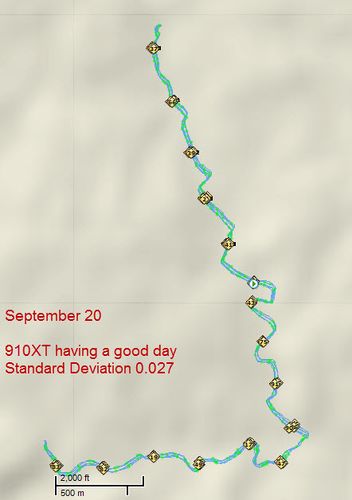 The Garmin 910XT on the same run having no problems, and only the standard, expected level of inaccuracy. |
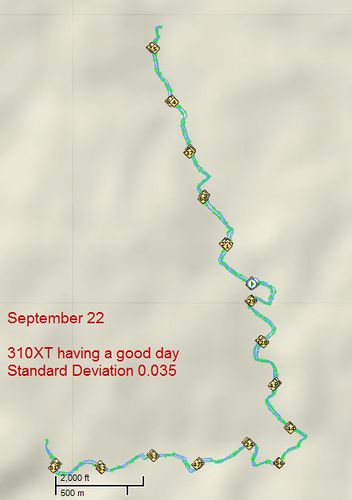 Two days later and it's the turn of the Garmin 310XT to have a good day. |
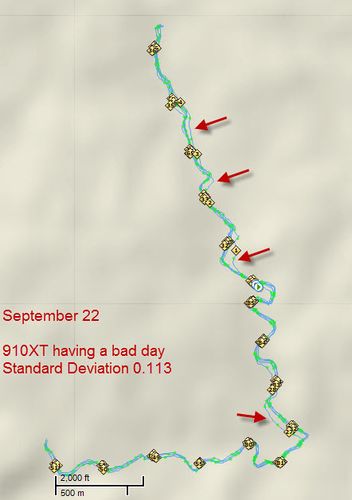 Again, this track is recorded on the same run as the image to the left. The Garmin 910XT gets a little confused at the start, and then again around lap 27. |
6 Next Steps
This is an initial analysis of the data I have, and there are a number of further evaluations to do.
- Gather data from some other GPS Running Watches.
- I will evaluate the Garmin 620 when it becomes available as it has some promising functionality.
- Add in some graphs of the distribution of accuracy, and possibly a Q-Q plot (which shows reasonably normal distribution).
- Check how GPS accuracy changes over the course of a run, as I've seen a distinct tendency for the watches to say they are good to go when they don't really have an optimal lock on the satellites.
- Look at how accurate the GPS watches are for measuring elevation, and compare with barometric data.
- Check for any correlation between accuracy and running pace.
- Look for any correlation between accuracy and the use of Heart Rate Monitor. The radio signal from the heart rate monitor could interfere with accuracy.
- Write up general GPS accuracy.
- List the sources of potential error.
- Evaluate the accuracy of the Footpod alone, both trueness and precision.

