Test
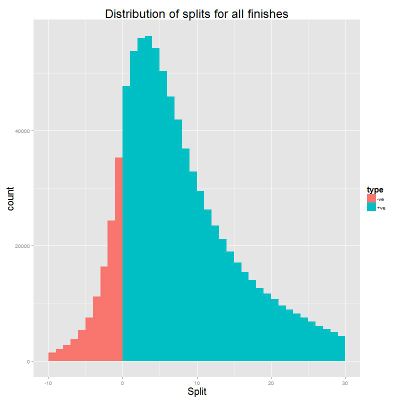
The results of 26 marathons covering 876,703 results for 754,851 runners were analyzed to look at the differences between positive and negative splits. Overall 13% of finishes were negative splits, with a mean split of positive 8.25%. Faster runners have a narrower distribution of splits and a mean closer to even. Looking at the 192,585 runners who have more than one finish in the same city, only 10% of the best performances are with a negative split, though a higher portion of the 2:00 to 2:30 and 4:00 to 5:00 finishes were negative. The subset of runners who have both a positive and negative split shows that 52% had their best performance with a negative split and the most common split for a best performance is negative 0-1%. Not surprisingly the biggest change in performance relates to extreme positive splits being much slower than more even splits. Overall, the data suggests that it's beneficial to have a split time that is close to even, with a slightly negative split possibly being optimal.
Contents
[hide]1 Method
The New York City and Chicago marathons use electronic timing that records the start, finish and half way times for runners. These races have little elevation change; NYC has around 900 feet (300m) of ascent and descent, and Chicago is effectively flat. Data is publically available for the New York marathon from 2000 to 2011 and the Chicago marathon from 1998 to 2012. (The results of the 2007 Chicago marathon were excluded as that year the race was unusually hot.) The results were grouped within race location using name and age so that multiple finishes by the same individual could be compared. This gives data for 26 races, covering 876,703 results for 754,851 runners.
2 Runners with multiple entries
We have 72,259 runners with multiple entries, with the distribution shown below.
| Count of finishes | 2 | 3 | 4 | 5 | 6 | 7 | 8 | 9 | 10 | 11 | 12 |
|---|---|---|---|---|---|---|---|---|---|---|---|
| Number of runners finishing | 48,548 | 13,253 | 5,405 | 1,963 | 1,076 | 609 | 394 | 336 | 240 | 220 | 215 |
3 Distribution of Splits
This is section looks at the distribution of splits. Each finish has its split percentage calculated based on the overall finish time and the half way time. The distribution is analyzed for all runners, then for different groups of runners based on their finish time.
3.1 Distribution of All Splits
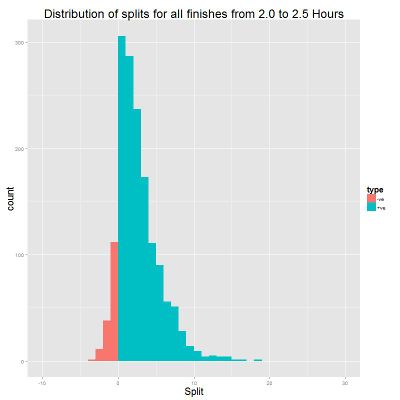
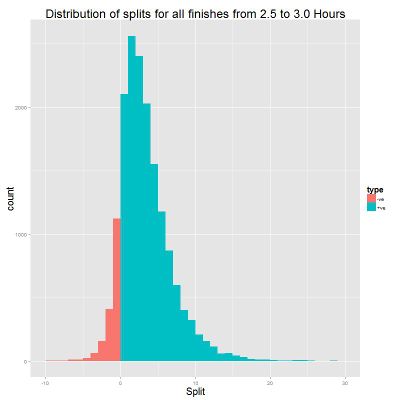
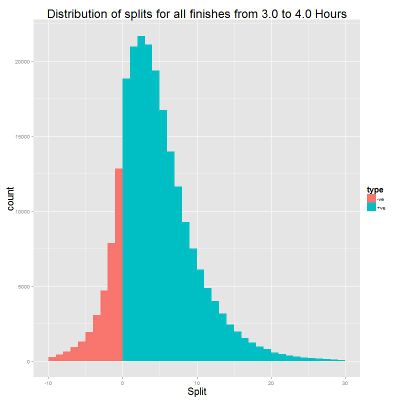
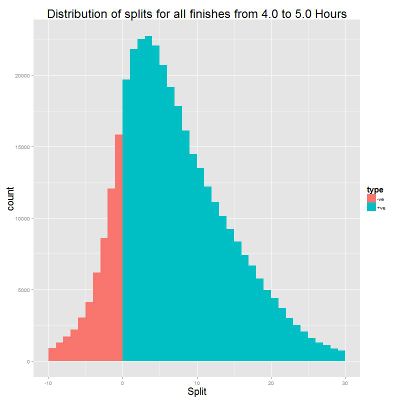
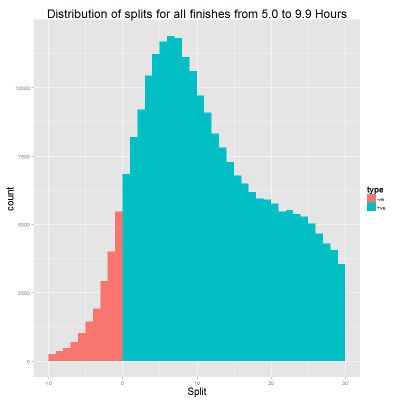
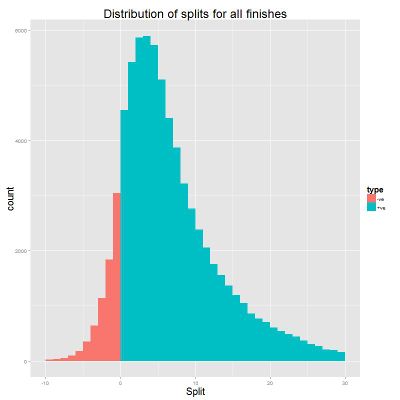
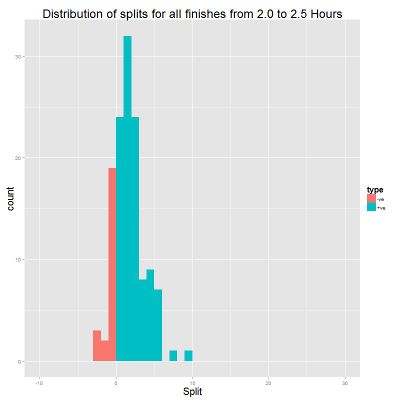
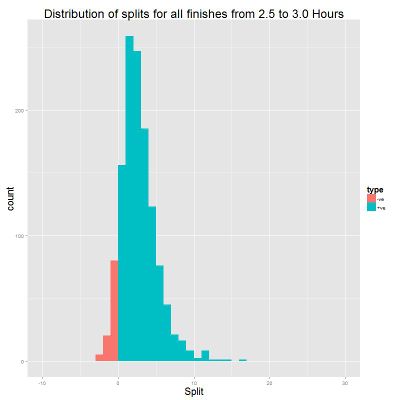
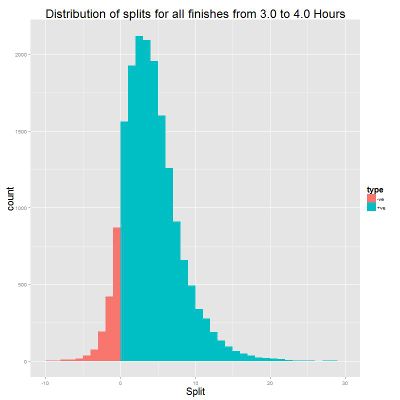
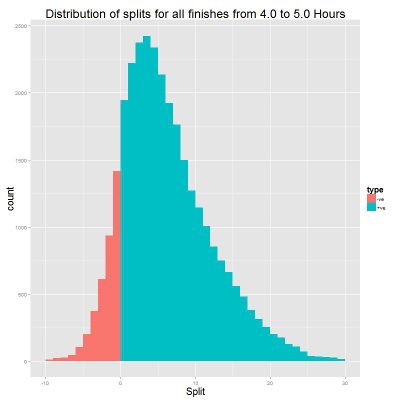
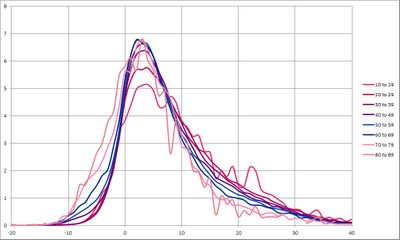
This section looks at the distribution of splits for all finishes. Overall, 87% finishes were positive splits and 13% were negative splits. This ratio is similar when the splits are divided by finish time, with the exception of those finishing in over five hours, where the percentage of negative splits is somewhat lower. However, the distribution of splits varies with finish time, with the fastest runners having a quite narrow distribution, and the distribution widening with each successively slower group. The peak of the curve is also at a more positive split value for slower groups. This suggests that faster runners tend to run a more even pace than slower runners.
Below is a table of statistics for the breakdown of splits, which give another view on the data. Again you can see that the faster runners have a narrower spread of splits (standard deviation) and their average splits are closer to even.
| Finish Time | Negative Split | Positive Split | Count | Mean | Interquartile Mean | Median | Standard Deviation |
|---|---|---|---|---|---|---|---|
| 2:00 to 2:30 | 10% | 89% | 1,544 | 2.65 | 2.13 | 2.07 | 2.75 |
| 2:30 to 3:00 | 11% | 89% | 16,528 | 3.35 | 2.83 | 2.74 | 3.43 |
| 3:00 to 4:00 | 15% | 85% | 225,004 | 4.53 | 3.89 | 3.78 | 5.32 |
| 4:00 to 5:00 | 16% | 84% | 368,165 | 7.17 | 6.13 | 5.87 | 7.94 |
| over 5:00 | 7% | 93% | 263,936 | 13.25 | 11.66 | 11.04 | 11.56 |
| total | 13% | 87% | 875,177 | 8.25 | 6.49 | 6.13 | 9.3 |
Below is an alternative breakdown of splits into positive, even and negative splits by finish time. For this table a split is considered even if it is +/-0.5%.
| Finish Time | Negative Split (<-0.5%) | Even Split (-0.5% to 0.5%) | Positive Split (>0.5%) |
|---|---|---|---|
| 2:00 to 2:30 | 6% | 14% | 80% |
| 2:30 to 3:00 | 7% | 10% | 83% |
| 3:00 to 4:00 | 12% | 7% | 81% |
| 4:00 to 5:00 | 13% | 5% | 82% |
| over 5:00 | 6% | 2% | 92% |
| total | 11% | 5% | 85% |
3.2 Distribution of Best Splits
This section looks at the finishes of runners with more than one finish in a city. This allows us to look at which split percentage resulted in their best time. This is a much smaller subset of the results, including ~22% of the overall results (192,585 of 876,703). For this subset of finishes the elite runners (sub 2:30) have a higher percentage of negative splits, but runners finishing between 2:30 and 5:00 have a lower percentage of negative splits when compared with all finishes shown above. The most significant difference however is that the best splits have a much narrower spread; that is the best splits are generally closer to even, with fewer finishes in either the extreme negative or positive range.
Here is the data in tabular form, showing the lower standard deviation than the overall splits. While the splits are closer to even, the pattern of the mean becoming more positive and the standard deviation increasing as the runners become slower is the same as the overall results.
| Finish Time | Negative Split | Positive Split | Count | Mean | Interquartile Mean | Median | Standard Deviation |
|---|---|---|---|---|---|---|---|
| 2:00 to 2:30 | 18% | 82% | 130 | 1.67 | 1.48 | 1.42 | 1.94 |
| 2:30 to 3:00 | 8% | 92% | 1,255 | 2.74 | 2.46 | 2.42 | 2.33 |
| 3:00 to 4:00 | 9% | 91% | 17,440 | 4.19 | 3.76 | 3.7 | 3.74 |
| 4:00 to 5:00 | 12% | 88% | 30,889 | 6.21 | 5.36 | 5.17 | 6.04 |
| over 5:00 | 9% | 91% | 22,545 | 10.16 | 8.65 | 8.27 | 8.99 |
| total | 10% | 90% | 72,259 | 6.89 | 5.49 | 5.23 | 7.07 |
Below is the alternative breakdown of splits into positive, even and negative splits by finish time.
| Finish Time | Negative Split (<-0.5%) | Even Split (-0.5% to 0.5%) | Positive Split (>0.5%) |
|---|---|---|---|
| 2:00 to 2:30 | 15% | 16% | 69% |
| 2:30 to 3:00 | 4% | 10% | 87% |
| 3:00 to 4:00 | 6% | 6% | 88% |
| 4:00 to 5:00 | 9% | 5% | 86% |
| over 5:00 | 7% | 3% | 90% |
| total | 7% | 5% | 88% |
3.3 Distribution of Best Performance for Runners with Both Positive and Negative Split
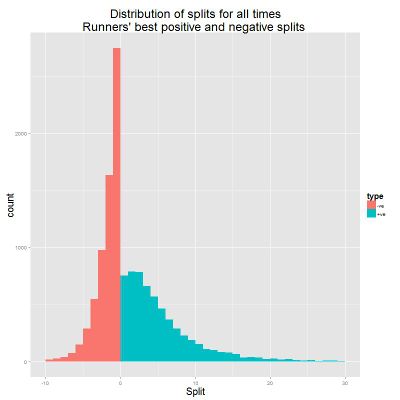
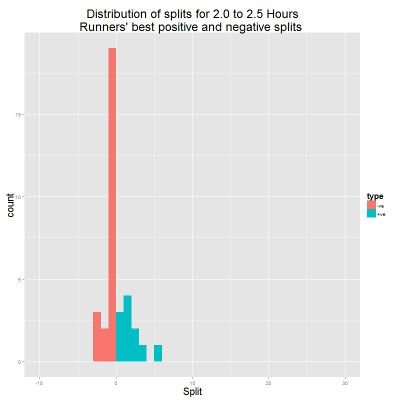
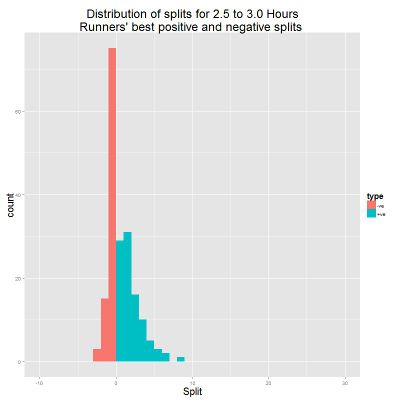
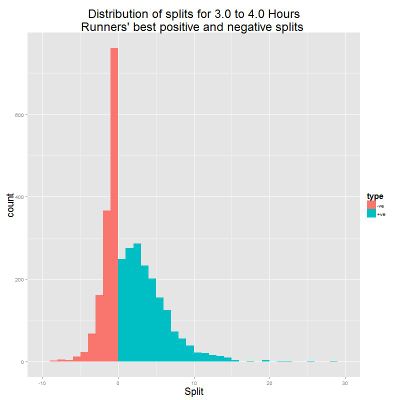
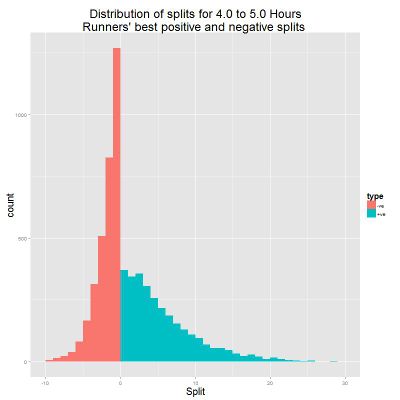
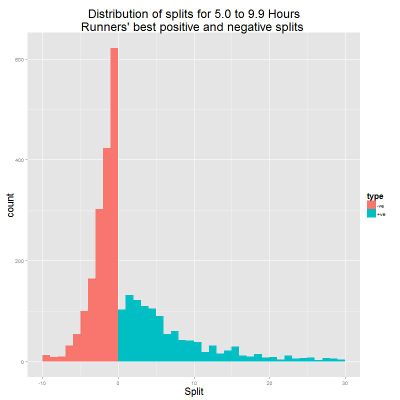
This section looks at the best performance from runners who had both a positive and negative split result. This is a much smaller subset of the result, including just 12,425 finishes (1.4% of the finishes, 1.6% of the runners). Of those runners, 52% did better with a negative split and 48% on a positive split. If we look at the distribution by finish time, we see that not surprisingly the faster runners run close to even splits, with just a couple of percent variation. As the finish times get longer, so the distribution of the split percentage flattens out.
Here's a tabular breakdown of the same data.
| Finish Time | Negative Split | Positive Split | Count | Mean | Interquartile Mean | Median | Standard Deviation |
|---|---|---|---|---|---|---|---|
| 2:00 to 2:30 | 69% | 31% | 35 | 0.02 | -0.29 | -0.36 | 1.62 |
| 2:30 to 3:00 | 49% | 51% | 190 | 0.69 | 0.32 | 0.01 | 1.8 |
| 3:00 to 4:00 | 44% | 56% | 3182 | 1.71 | 1.03 | 0.74 | 3.65 |
| 4:00 to 5:00 | 53% | 47% | 6135 | 1.64 | 0.48 | -0.12 | 5.11 |
| over 5:00 | 61% | 39% | 2883 | 1.48 | -0.13 | -0.48 | 6.75 |
| Total | 52% | 48% | 12425 | 1.6 | 0.49 | -0.09 | 5.19 |
Below is the alternative breakdown of splits into positive, even and negative splits by finish time.
| Finish Time | Negative Split (<-0.5%) | Even Split (-0.5% to 0.5%) | Positive Split (>0.5%) |
|---|---|---|---|
| 2:00 to 2:30 | 37% | 34% | 29% |
| 2:30 to 3:00 | 21% | 36% | 43% |
| 3:00 to 4:00 | 30% | 19% | 52% |
| 4:00 to 5:00 | 41% | 15% | 44% |
| over 5:00 | 50% | 13% | 37% |
| total | 40% | 16% | 44% |
4 Performance Changes against Splits Percentage
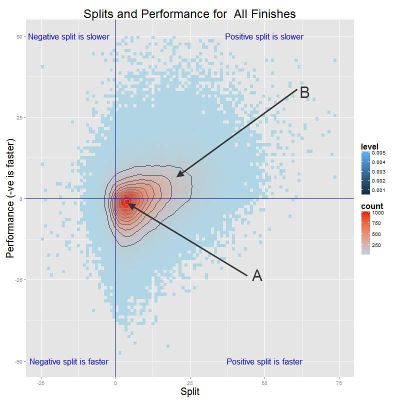
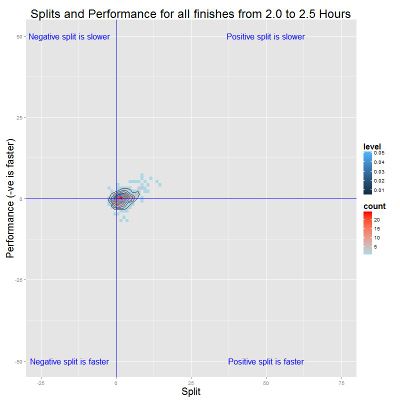
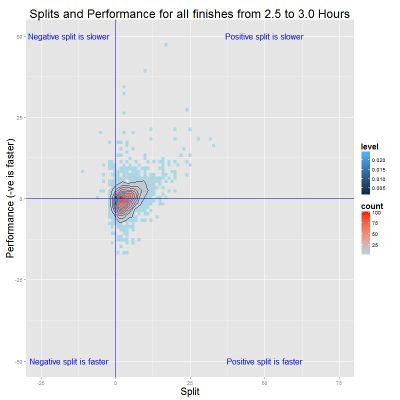
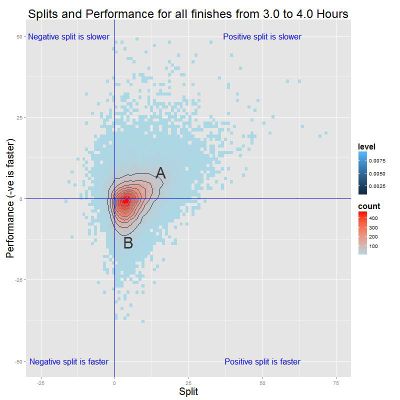
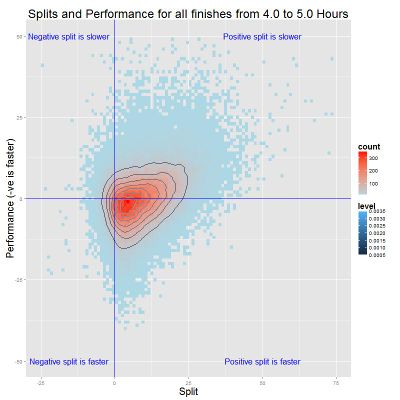
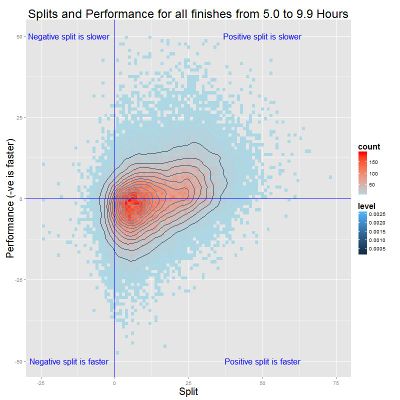
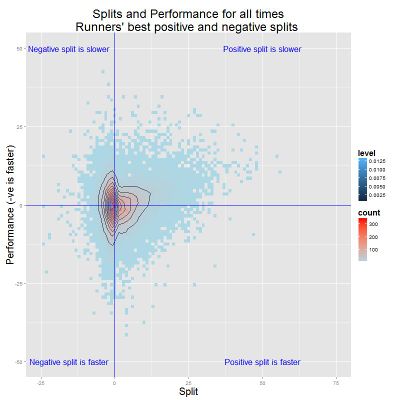
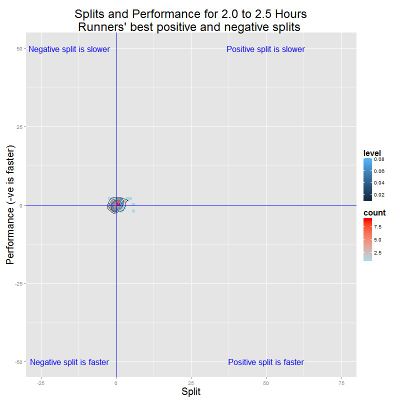
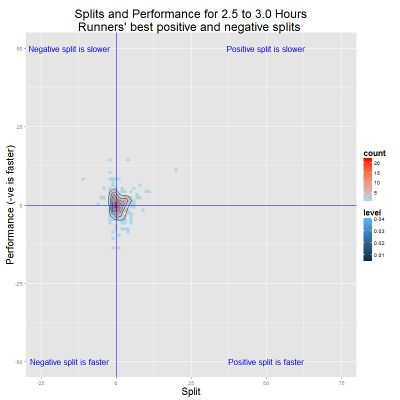
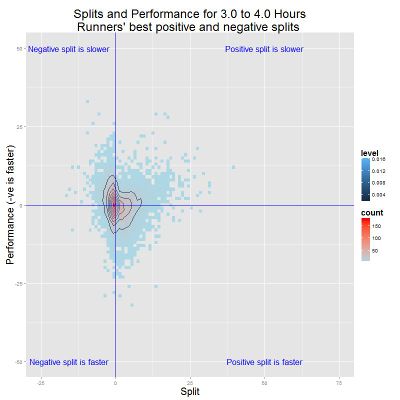
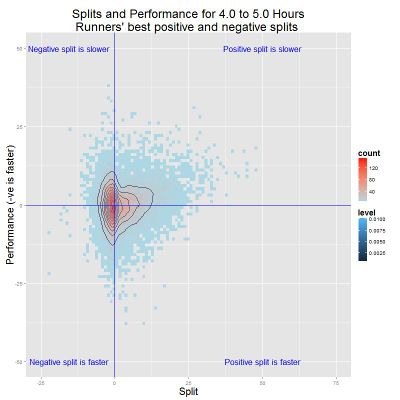
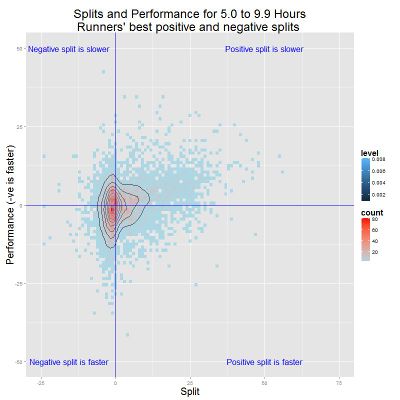
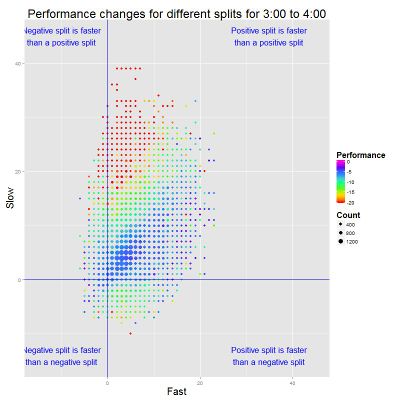
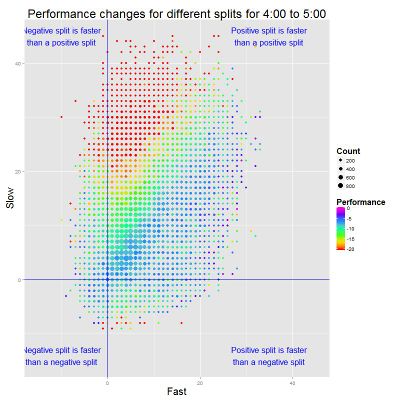
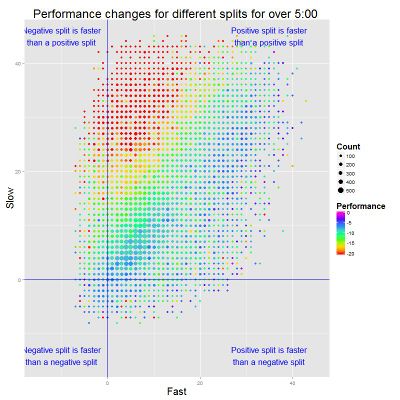
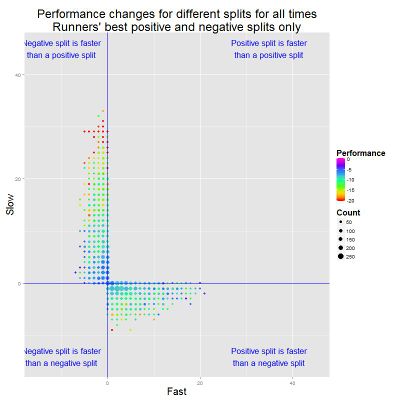
Next we look at how the magnitude of the performance change is related to the split percentage. The charts below plot all results by the split percentage against the relative performance of the result. The relative performance is based on a comparison with the average for that runner in that city's race. The color on the chart represents the density of results, as do the contour lines.
4.1 All finishes
These graphs show all finishes, and as you would expect given the overall distribution of splits, there is a general bias towards positive splits. Further details given under each image, but there are some general trends:
- The negative split finishes have a similar distribution between being faster and slower than the runner's average time. The exception is runners finishing in over 5 hours, where the negative split appears to have slightly more benefit.
- There is a strong bias towards the more positive splits being slower.
- Faster runners tend to be more even in their splits.
4.2 Comparing the best positive and negative finish
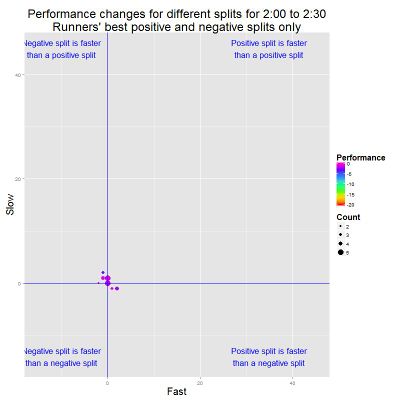
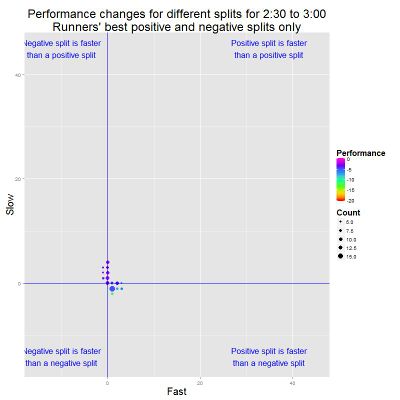
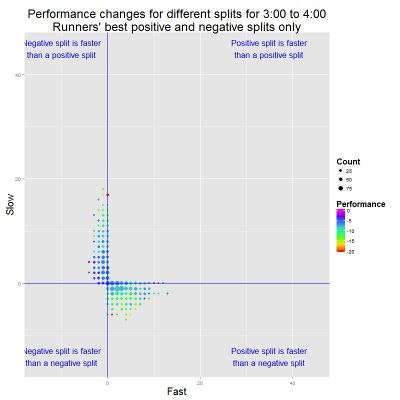
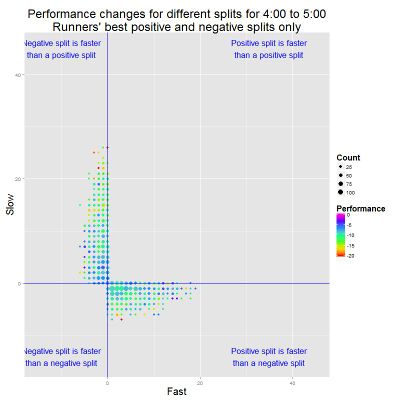
These graphs look at runners with both a positive and a negative split finish. If a runner has multiple positive or negative split finishes, then the best performance in each category is used. The runner's average performance from all finishes is used to determine which time group their results are placed in. By their nature, these graphs have an equal number of positive and negative split finishes.
5 Average performance change between splits
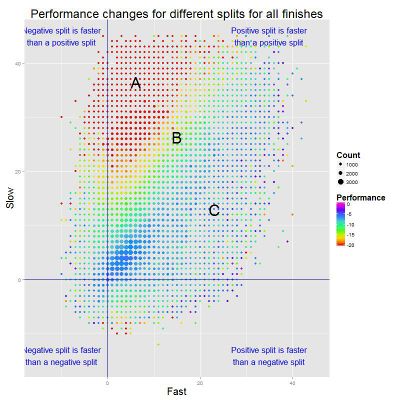
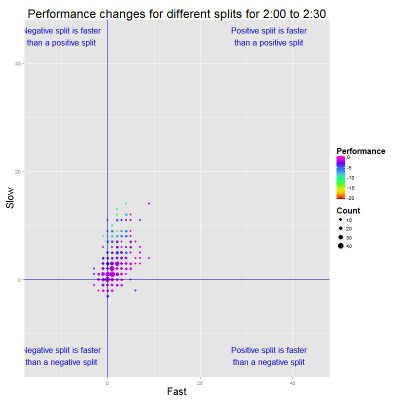
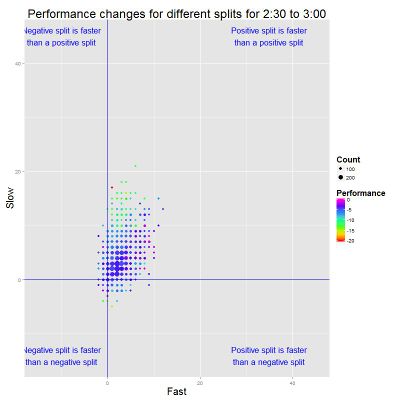
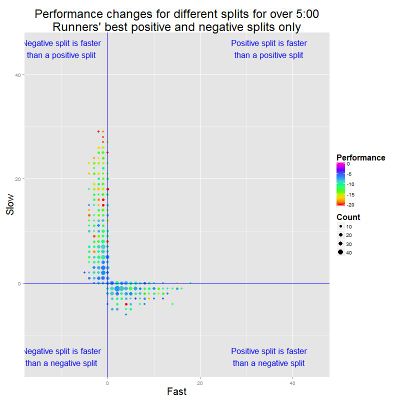
These graphs show the average change in performance for the combinations of splits. For example, if a runner has two finishes, a 5% positive split and a 2% negative split and the negative split is 10% faster, then an entry is added to the bin for -2% (x axis), 5% (y axis) and a -10% value. Each combination of positive and negative split is then averaged. The graph has the average performance change as the color and the size indicates the number of entries. (Note average performance changes greater than 20% are capped and shown red.)
5.1 All finishes
These charts map all combinations of finishes for all runners with more than one finish in a race.
5.2 Comparing the best positive and negative finish
Like previous sections, these graphs look at runners' best positive and negative split finishes. Because only positive to negative splits are compared, only those two quadrants are populated.
6 Variations by Age and Gender
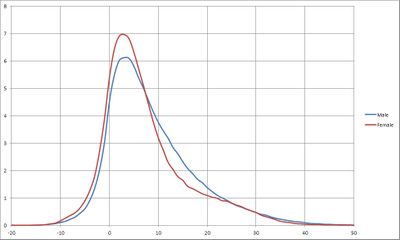
The distribution of splits does not vary much by age or gender.
7 Sources of Error
There are a number of possible errors within the data.
- Not all results included the half way split, probably due to an error with the electronic timing mechanism. These results are ignored.
- Some runners may not be running to achieve their best time, such as runners acting as pacers.
- Runners were identified by using their age on race day to provide a year of birth. However, because the date of the race varies slightly, people with their birthday around this time may not get their results grouped together.
- The name provided on the race results for a given runner may vary depending on the use of nicknames or due to data entry errors.
8 Conclusions
Obviously it is not possible to draw causal conclusions from this type of data.
- Negative splits are relatively unusual, and typically a runner will only be negative by 0-3%.
- Most runners have their best performance with a slight positive split.
- Faster runners have more even splits, probably because they are better at pacing.
- Slow runners have a broader spread of splits than faster runners, and their mean split percentage increases.
- Not surprisingly, a large positive split reflects a massive slowdown in the second half of the race and is associated with the poorest performances.
- Overall, negative splits are slightly (52%) more likely to result in a better performance than a positive split. However, for the fastest runners (sub-2:30), the negative split is 69% of best performances and 61% of over-5:00.
- Of runners how tried both positive and negative splits, a slightly negative split is the most common best performance.
9 Appendix - Table of Split Times
This table shows sample split percentages for various finish times.
| Finish Time | -10% | -5% | 5% | 10% | 15% | 20% | 25% | 30% |
|---|---|---|---|---|---|---|---|---|
| 2:00:00 | 1:06:40/0:53:20 (13:20) | 1:03:09/0:56:51 (6:18) | 0:57:09/1:02:51 (5:42) | 0:54:33/1:05:27 (10:54) | 0:52:10/1:07:50 (15:40) | 0:50:00/1:10:00 (20:00) | 0:48:00/1:12:00 (24:00) | 0:46:09/1:13:51 (27:42) |
| 2:10:00 | 1:12:13/0:57:47 (14:26) | 1:08:25/1:01:35 (6:50) | 1:01:54/1:08:06 (6:12) | 0:59:05/1:10:55 (11:50) | 0:56:31/1:13:29 (16:58) | 0:54:10/1:15:50 (21:40) | 0:52:00/1:18:00 (26:00) | 0:50:00/1:20:00 (30:00) |
| 2:20:00 | 1:17:47/1:02:13 (15:34) | 1:13:41/1:06:19 (7:22) | 1:06:40/1:13:20 (6:40) | 1:03:38/1:16:22 (12:44) | 1:00:52/1:19:08 (18:16) | 0:58:20/1:21:40 (23:20) | 0:56:00/1:24:00 (28:00) | 0:53:51/1:26:09 (32:18) |
| 2:30:00 | 1:23:20/1:06:40 (16:40) | 1:18:57/1:11:03 (7:54) | 1:11:26/1:18:34 (7:08) | 1:08:11/1:21:49 (13:38) | 1:05:13/1:24:47 (19:34) | 1:02:30/1:27:30 (25:00) | 1:00:00/1:30:00 (30:00) | 0:57:42/1:32:18 (34:36) |
| 2:40:00 | 1:28:53/1:11:07 (17:46) | 1:24:13/1:15:47 (8:26) | 1:16:11/1:23:49 (7:38) | 1:12:44/1:27:16 (14:32) | 1:09:34/1:30:26 (20:52) | 1:06:40/1:33:20 (26:40) | 1:04:00/1:36:00 (32:00) | 1:01:32/1:38:28 (36:56) |
| 2:50:00 | 1:34:27/1:15:33 (18:54) | 1:29:28/1:20:32 (8:56) | 1:20:57/1:29:03 (8:06) | 1:17:16/1:32:44 (15:28) | 1:13:55/1:36:05 (22:10) | 1:10:50/1:39:10 (28:20) | 1:08:00/1:42:00 (34:00) | 1:05:23/1:44:37 (39:14) |
| 3:00:00 | 1:40:00/1:20:00 (20:00) | 1:34:44/1:25:16 (9:28) | 1:25:43/1:34:17 (8:34) | 1:21:49/1:38:11 (16:22) | 1:18:16/1:41:44 (23:28) | 1:15:00/1:45:00 (30:00) | 1:12:00/1:48:00 (36:00) | 1:09:14/1:50:46 (41:32) |
| 3:10:00 | 1:45:33/1:24:27 (21:06) | 1:40:00/1:30:00 (10:00) | 1:30:29/1:39:31 (9:02) | 1:26:22/1:43:38 (17:16) | 1:22:37/1:47:23 (24:46) | 1:19:10/1:50:50 (31:40) | 1:16:00/1:54:00 (38:00) | 1:13:05/1:56:55 (43:50) |
| 3:20:00 | 1:51:07/1:28:53 (22:14) | 1:45:16/1:34:44 (10:32) | 1:35:14/1:44:46 (9:32) | 1:30:55/1:49:05 (18:10) | 1:26:57/1:53:03 (26:06) | 1:23:20/1:56:40 (33:20) | 1:20:00/2:00:00 (40:00) | 1:16:55/2:03:05 (46:10) |
| 3:30:00 | 1:56:40/1:33:20 (23:20) | 1:50:32/1:39:28 (11:04) | 1:40:00/1:50:00 (10:00) | 1:35:27/1:54:33 (19:06) | 1:31:18/1:58:42 (27:24) | 1:27:30/2:02:30 (35:00) | 1:24:00/2:06:00 (42:00) | 1:20:46/2:09:14 (48:28) |
| 3:40:00 | 2:02:13/1:37:47 (24:26) | 1:55:47/1:44:13 (11:34) | 1:44:46/1:55:14 (10:28) | 1:40:00/2:00:00 (20:00) | 1:35:39/2:04:21 (28:42) | 1:31:40/2:08:20 (36:40) | 1:28:00/2:12:00 (44:00) | 1:24:37/2:15:23 (50:46) |
| 3:50:00 | 2:07:47/1:42:13 (25:34) | 2:01:03/1:48:57 (12:06) | 1:49:31/2:00:29 (10:58) | 1:44:33/2:05:27 (20:54) | 1:40:00/2:10:00 (30:00) | 1:35:50/2:14:10 (38:20) | 1:32:00/2:18:00 (46:00) | 1:28:28/2:21:32 (53:04) |
| 4:00:00 | 2:13:20/1:46:40 (26:40) | 2:06:19/1:53:41 (12:38) | 1:54:17/2:05:43 (11:26) | 1:49:05/2:10:55 (21:50) | 1:44:21/2:15:39 (31:18) | 1:40:00/2:20:00 (40:00) | 1:36:00/2:24:00 (48:00) | 1:32:18/2:27:42 (55:24) |
| 4:10:00 | 2:18:53/1:51:07 (27:46) | 2:11:35/1:58:25 (13:10) | 1:59:03/2:10:57 (11:54) | 1:53:38/2:16:22 (22:44) | 1:48:42/2:21:18 (32:36) | 1:44:10/2:25:50 (41:40) | 1:40:00/2:30:00 (50:00) | 1:36:09/2:33:51 (57:42) |
| 4:20:00 | 2:24:27/1:55:33 (28:54) | 2:16:51/2:03:09 (13:42) | 2:03:49/2:16:11 (12:22) | 1:58:11/2:21:49 (23:38) | 1:53:03/2:26:57 (33:54) | 1:48:20/2:31:40 (43:20) | 1:44:00/2:36:00 (52:00) | 1:40:00/2:40:00 (60:00) |
| 4:30:00 | 2:30:00/2:00:00 (30:00) | 2:22:06/2:07:54 (14:12) | 2:08:34/2:21:26 (12:52) | 2:02:44/2:27:16 (24:32) | 1:57:23/2:32:37 (35:14) | 1:52:30/2:37:30 (45:00) | 1:48:00/2:42:00 (54:00) | 1:43:51/2:46:09 (62:18) |
| 4:40:00 | 2:35:33/2:04:27 (31:06) | 2:27:22/2:12:38 (14:44) | 2:13:20/2:26:40 (13:20) | 2:07:16/2:32:44 (25:28) | 2:01:44/2:38:16 (36:32) | 1:56:40/2:43:20 (46:40) | 1:52:00/2:48:00 (56:00) | 1:47:42/2:52:18 (64:36) |
| 4:50:00 | 2:41:07/2:08:53 (32:14) | 2:32:38/2:17:22 (15:16) | 2:18:06/2:31:54 (13:48) | 2:11:49/2:38:11 (26:22) | 2:06:05/2:43:55 (37:50) | 2:00:50/2:49:10 (48:20) | 1:56:00/2:54:00 (58:00) | 1:51:32/2:58:28 (66:56) |
| 5:00:00 | 2:46:40/2:13:20 (33:20) | 2:37:54/2:22:06 (15:48) | 2:22:51/2:37:09 (14:18) | 2:16:22/2:43:38 (27:16) | 2:10:26/2:49:34 (39:08) | 2:05:00/2:55:00 (50:00) | 2:00:00/3:00:00 (60:00) | 1:55:23/3:04:37 (69:14) |
| 5:10:00 | 2:52:13/2:17:47 (34:26) | 2:43:09/2:26:51 (16:18) | 2:27:37/2:42:23 (14:46) | 2:20:55/2:49:05 (28:10) | 2:14:47/2:55:13 (40:26) | 2:09:10/3:00:50 (51:40) | 2:04:00/3:06:00 (62:00) | 1:59:14/3:10:46 (71:32) |
| 5:20:00 | 2:57:47/2:22:13 (35:34) | 2:48:25/2:31:35 (16:50) | 2:32:23/2:47:37 (15:14) | 2:25:27/2:54:33 (29:06) | 2:19:08/3:00:52 (41:44) | 2:13:20/3:06:40 (53:20) | 2:08:00/3:12:00 (64:00) | 2:03:05/3:16:55 (73:50) |
| 5:30:00 | 3:03:20/2:26:40 (36:40) | 2:53:41/2:36:19 (17:22) | 2:37:09/2:52:51 (15:42) | 2:30:00/3:00:00 (30:00) | 2:23:29/3:06:31 (43:02) | 2:17:30/3:12:30 (55:00) | 2:12:00/3:18:00 (66:00) | 2:06:55/3:23:05 (76:10) |
| 5:40:00 | 3:08:53/2:31:07 (37:46) | 2:58:57/2:41:03 (17:54) | 2:41:54/2:58:06 (16:12) | 2:34:33/3:05:27 (30:54) | 2:27:50/3:12:10 (44:20) | 2:21:40/3:18:20 (56:40) | 2:16:00/3:24:00 (68:00) | 2:10:46/3:29:14 (78:28) |
| 5:50:00 | 3:14:27/2:35:33 (38:54) | 3:04:13/2:45:47 (18:26) | 2:46:40/3:03:20 (16:40) | 2:39:05/3:10:55 (31:50) | 2:32:10/3:17:50 (45:40) | 2:25:50/3:24:10 (58:20) | 2:20:00/3:30:00 (70:00) | 2:14:37/3:35:23 (80:46) |
| 6:00:00 | 3:20:00/2:40:00 (40:00) | 3:09:28/2:50:32 (18:56) | 2:51:26/3:08:34 (17:08) | 2:43:38/3:16:22 (32:44) | 2:36:31/3:23:29 (46:58) | 2:30:00/3:30:00 (60:00) | 2:24:00/3:36:00 (72:00) | 2:18:28/3:41:32 (83:04) |
