Glycemic Index
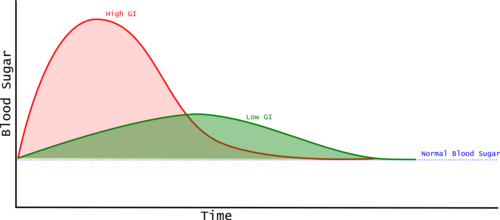
Glycemic Index (GI) is a measure of how much a food raises blood glucose (blood sugar). A food with a higher Glycemic Index raises the blood sugar more than a food with a lower Glycemic Index. The Glycemic Index value is based on a comparison with a reference food, normally either white bread or glucose. High Glycemic Index foods are linked to a wide variety of health problems, but there is evidence that different people may have widely differing Glycemic Indexes for the same food.
Contents
1 Calculating the Glycemic Index
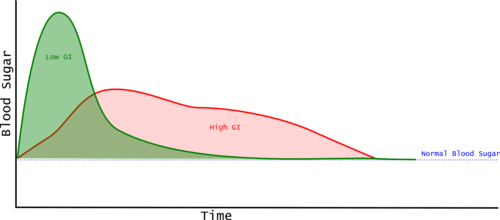
The Glycemic Index is calculated by measuring blood glucose periodically after the consumption of the food. Typically the measurements are taken just before consuming the food, then at 15, 30, 45, 60, 90, and 120 minutes[1]. These measurements provide a blood glucose curve, and the area between the curve and the baseline measurement taken just before consuming the food is the "incremental Area Under the Curve" (iUAC). The iUAC is compared with the iUAC for a reference food and the value given as a percentage. So a Glycemic Index of 50 means that the food raises the blood sugar by 50% of the reference food. Generally the portion of test food consumed contains 50 grams of carbohydrate. (The iAUC is sometimes called the Post Prandial Glycemic Response or PPGC.)
Most Glycemic Index examples show two foods, with the high G.I. food having a higher peak blood glucose and a greater incremental Area Under the Curve (iAUC). However, this is not always the case, and Glycemic Index is based only on the iAUC, so a food that rapidly spikes the blood glucose and then the level drops quickly can have a lower iAUC than a food that keeps the blood glucose at a moderate level for longer. This means that Glycemic Index alone may not tell us as much as we'd like.
2 Glycemic Index and Health
High blood glucose levels are linked to many health problems.
- High Glycemic Index foods may be associated with obesity[2][3][4] which constitutes a major health risk[5].
- Lower Glycemic Index foods are considered critical to preventing metabolic syndrome, as it is the high Glycemic Index foods that are risk factors, not carbohydrates as a whole [6].
- Elevated blood glucose after consuming food (Postprandial Hyperglycemia) is an independent risk factor for heart disease and high blood pressure [7].
- Postprandial Hyperglycemia is associated with an increased risk of stroke and heart attacks[8].
- Postprandial Hyperglycemia is associated with the risk of death in both diabetics and the overall population, independent of age, blood pressure, cholesterol, body mass index, and smoking habit [9].
- Lower Glycemic Index foods may improve HDL (Healthy) Cholesterol levels[10][11].
- Elevated blood glucose and insulin are associated with cancers of the colon[12][13][14], breast[15], and prostrate[16][17][18]. It's been suggested that the high mortality rate from most cancers in obese subjects may be due to elevated insulin[19]
- Diets with Lower Glycemic Index foods may help manage Impaired Glucose Tolerance (IGT)[20]
- IGT is a risk factor for Type 2 Diabetes, with estimates that 70% of those with IGT will eventually develop Diabetes[21], with 5-10% succumbing each year[22].
- IGT is also linked with metabolic syndrome, which is the cluster of health problems including obesity, high blood pressure, non-alcoholic fatty liver disease, elevated triglycerides, and cardiovascular disease[23]. (Note that while glucose lowering drugs may help prevent the conversion of IGT to Diabetes, but it's unclear if they will help prevent some of the health complications of diabetes[23].)
- IGT is a risk factor for liver cirrhosis[24] and survival rates for those with liver cirrhosis[25].
3 Individuality and the Glycemic Index
Most metrics around foods are based on relatively simple, objective measures of the food itself. In contrast, the Glycemic Index is a measure of how the human body reacts to a food, rather than just an attribute of the food in isolation. Studies have shown large variability in the Glycemic Index measured for given foods between individuals as well as large variability for repeated tests on the same individuals[26][27]. A 2015 study attempted to understand and model the individual Glycemic Index responses[28]. This study used continuous glucose monitoring of 800 subjects for a week, with the subjects recording their food intake, sleep, and exercise electronically. This provided a remarkable 1.5 million glucose measurements over 5,435 person/days. The study found a number of things:
- A higher Glycemic Response (iAUC) was related to obesity (greater BMI), higher HbA1c (an indicator of average blood glucose over time), fasting blood glucose, and age. This tends to confirm the importance of Glycemic Index, but underlines the individual variability.
- Unlike earlier studies, this study indicates that the glycemic response has a lower variability for a given individual.
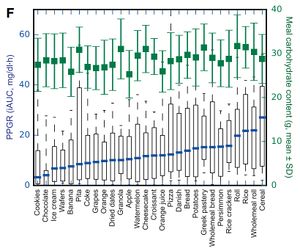
- Glycemic Index is normalized to the Glycemic Response for a standardized meal, which makes it a relative rather than absolute measure. This study did evaluate the absolute Glycemic Response, and found large variability for the standardized meals. Even Fructose, which has lower variability, still has a few individuals with a surprisingly high absolute Glycemic Response (see below).
- Even when the Glycemic Responses are normalized to that of glucose, there are still remarkably high levels of variability. The diagram below shows that white bread, which is typically reported as having a Glycemic Index of around 71 has some individuals with extremely low Glycemic Index responses, and some that are much higher. Even fructose has some individuals with an indicated Glycemic Index of over 100, when the literature indicates it is generally around 19.
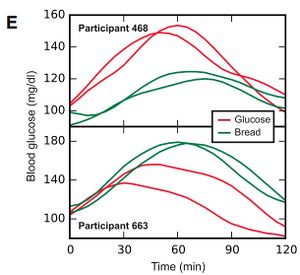
- This individual variability is a nicely shown in the blood glucose responses shown below. These graphs show the responses of two individuals to glucose and bread. Each test was repeated, giving two lines for each participant's response to each of the two foods. You can see that each participant had reasonably similar responses each time they ate each of the foods. However, the top participant had a much higher Glycemic Response to glucose than a bread, this is what would be expected from the published Glycemic Index values. However, the participant in the lower graph has an inverted response, with higher glycemic response to bread than glucose.
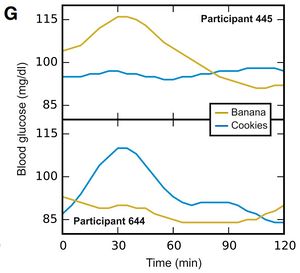
- The graphs below show two individuals Glycemic Response to bananas and cookies. Here you can see the individuals had opposite responses to the two foods. Personally, I am a little cautious in interpreting this data as the bananas and cookies were not standardized. It's possible that the top participant had an extremely ripe banana, and a high fat cookie, while the lower participant had an unripe banana, and a low fat cookie.
- While the study found large variability, it also found that the average Glycemic Response generally corresponded well to the published figures.
The research team used the data from the 800 participants to create a computer model to predict the Glycemic Response of a further hundred subjects. This computer model was able to predict the Glycemic Response surprisingly well (r=0.70 for those into statistics.) Analysis of the computer model revealed a number of factors that tend to predict the glycemic response.
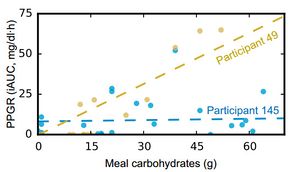
- As expected, the carbohydrate content of a meal is strongly related to the Glycemic Response. However, the model did reveal some subjects that seemed relatively insensitive to the overall carbohydrate content. It appears that about 5% of subjects had a Glycemic Response that was as high as the rest of the subjects, but wasn't related to the overall carbohydrate content. Below you can see the relationship of participant 49 whose glycemic response is broadly proportional to the carbohydrate response compared with participant 145 whose glycemic response appears unrelated to the overall carbohydrate content.
- The study also found the expected relationship between glycemic response and fat content. However, there were also individuals where the relationship between fat content glycemic response was not seen.
- The level of Fiber in a meal was linked to higher glycemic responses. While this seems counterintuitive, I suspect it's because meals that are high in fiber are often also high in carbohydrates, and finely ground whole wheat products often exhibit similar glycemic index is to those using white wheat flour. Higher fiber intake over a 24-hour period was related to lower glycemic responses.
- There were also indications that higher sodium levels, longer times since the last sleep and the subjects' cholesterol levels were also linked to higher glycemic responses.
- The study analyzed the digestive bacteria from stool samples, and found 21 beneficial strains and 28 non-beneficial strains of bacteria.
All this suggests that while the published Glycemic Index values are a useful rough guide to the health implications of various foods, they don't show the whole picture. It is possible to measure your own glycemic response, and I have some recommended Blood Glucose Meters. While it is impractical to perform this type of test on a wide variety of foods, I've measured my own glycemic response to a few of the meals that I eat most commonly. This measurement must be performed first thing in the morning on an empty stomach. Simply measure your fasting blood glucose, consumer the meal, then check your blood glucose over the next two hours. Measuring at 15, 30, 45, 60, 90, and 120 minutes will give you a standardized curve, but you could probably get away with far fewer measurements to get an approximation. You could normalize your values to a standardized meal, but I simply used an absolute value so that I could confirm what I was eating was not creating a health problem for me.
4 How Exercise Changes Glycemic Index
I found no studies that looked at how exercise changes the Glycemic Index of foods. The evidence available from looking at diabetic subjects suggests that exercise will lower the Glycemic Index of food consumed post exercise, and the effects of the exercise might last for up to 24 hours.
- A study showed that 30 minutes of cycling was 15 minutes after eating white bread reduced the Glycemic Index by about a third[29]. However, this study was on type-1 Diabetics and the subjects had a constant infusion of insulin.
- Another study found that 45-60 minutes of exercise reduced their blood glucose level for the following 24 hours[30].
- Studies of type-2 diabetics suggest that exercise generally lowers blood glucose (as measured by HA1c)[31][32].
5 Simple and Complex Carbohydrates
At one time, it was believed that "simple carbohydrates" had high Glycemic Index, while "complex carbohydrates" had lower Glycemic Indexes[33]. The difference between simple and complex carbohydrates is based on the chemistry of the carbohydrate molecule, with small molecules like sugar considered "simple" and big molecules like bread considered "complex". This division into simple and complex is unfortunately crap (biochemistry term meaning 'not useful'). The digestion of carbs is a sophisticated system that does not follow this simple division. Some simple carbs (Fructose) are very slow to digest, whereas some complex carbs (maltodextrin) are very easy to digest. For instance, white bread (a "complex" carb, GI 70) has a higher Glycemic Index than table sugar (a 'simple' carb, GI 60). This is because highly refined flour in bread is more easily digested than table sugar (which is half fructose).
6 References
- ↑ J. C Brand-Miller, K. Stockmann, F. Atkinson, P. Petocz, G. Denyer, Glycemic index, postprandial glycemia, and the shape of the curve in healthy subjects: analysis of a database of more than 1000 foods, American Journal of Clinical Nutrition, volume 89, issue 1, 2008, pages 97–105, ISSN 0002-9165, doi 10.3945/ajcn.2008.26354
- ↑ Susan B. Roberts, High-glycemic Index Foods, Hunger, and Obesity: Is There a Connection?, Nutrition Reviews, volume 58, issue 6, 2009, pages 163–169, ISSN 00296643, doi 10.1111/j.1753-4887.2000.tb01855.x
- ↑ JC. Brand-Miller, SH. Holt, DB. Pawlak, J. McMillan, Glycemic index and obesity., Am J Clin Nutr, volume 76, issue 1, pages 281S-5S, Jul 2002, PMID 12081852
- ↑ DS. Ludwig, JA. Majzoub, A. Al-Zahrani, GE. Dallal, I. Blanco, SB. Roberts, High glycemic index foods, overeating, and obesity., Pediatrics, volume 103, issue 3, pages E26, Mar 1999, PMID 10049982
- ↑ Ryan K. Masters, Eric N. Reither, Daniel A. Powers, Y. Claire Yang, Andrew E. Burger, Bruce G. Link, The Impact of Obesity on US Mortality Levels: The Importance of Age and Cohort Factors in Population Estimates, American Journal of Public Health, volume 103, issue 10, 2013, pages 1895–1901, ISSN 0090-0036, doi 10.2105/AJPH.2013.301379
- ↑ G. Riccardi, AA. Rivellese, Dietary treatment of the metabolic syndrome--the optimal diet., Br J Nutr, volume 83 Suppl 1, pages S143-8, Mar 2000, PMID 10889805
- ↑ JL. Chiasson, RG. Josse, R. Gomis, M. Hanefeld, A. Karasik, M. Laakso, Acarbose treatment and the risk of cardiovascular disease and hypertension in patients with impaired glucose tolerance: the STOP-NIDDM trial., JAMA, volume 290, issue 4, pages 486-94, Jul 2003, doi 10.1001/jama.290.4.486, PMID 12876091
- ↑ C. Stettler, S. Allemann, P. Jüni, CA. Cull, RR. Holman, M. Egger, S. Krähenbühl, P. Diem, Glycemic control and macrovascular disease in types 1 and 2 diabetes mellitus: Meta-analysis of randomized trials., Am Heart J, volume 152, issue 1, pages 27-38, Jul 2006, doi 10.1016/j.ahj.2005.09.015, PMID 16824829
- ↑ KT. Khaw, N. Wareham, R. Luben, S. Bingham, S. Oakes, A. Welch, N. Day, Glycated haemoglobin, diabetes, and mortality in men in Norfolk cohort of european prospective investigation of cancer and nutrition (EPIC-Norfolk)., BMJ, volume 322, issue 7277, pages 15-8, Jan 2001, PMID 11141143
- ↑ ES. Ford, S. Liu, Glycemic index and serum high-density lipoprotein cholesterol concentration among us adults., Arch Intern Med, volume 161, issue 4, pages 572-6, Feb 2001, PMID 11252117
- ↑ G. Frost, AA. Leeds, CJ. Doré, S. Madeiros, S. Brading, A. Dornhorst, Glycaemic index as a determinant of serum HDL-cholesterol concentration., Lancet, volume 353, issue 9158, pages 1045-8, Mar 1999, PMID 10199351
- ↑ G. McKeown-Eyssen, Epidemiology of colorectal cancer revisited: are serum triglycerides and/or plasma glucose associated with risk?, Cancer Epidemiol Biomarkers Prev, volume 3, issue 8, pages 687-95, Dec 1994, PMID 7881343
- ↑ E. Giovannucci, Insulin and colon cancer., Cancer Causes Control, volume 6, issue 2, pages 164-79, Mar 1995, PMID 7749056
- ↑ Paul J. Limburg, Rachael Z. Stolzenberg-Solomon, Robert A. Vierkant, Katherine Roberts, Thomas A. Sellers, Philip R. Taylor, Jarmo Virtamo, James R. Cerhan, Demetrius Albanes, Insulin, Glucose, Insulin Resistance, and Incident Colorectal Cancer in Male Smokers, Clinical Gastroenterology and Hepatology, volume 4, issue 12, 2006, pages 1514–1521, ISSN 15423565, doi 10.1016/j.cgh.2006.09.014
- ↑ L. Baglietto, DR. English, JL. Hopper, HA. Morris, WD. Tilley, GG. Giles, Circulating insulin-like growth factor-I and binding protein-3 and the risk of breast cancer., Cancer Epidemiol Biomarkers Prev, volume 16, issue 4, pages 763-8, Apr 2007, doi 10.1158/1055-9965.EPI-06-0960, PMID 17416768
- ↑ GA. Lima, LL. Corrêa, R. Gabrich, LC. Miranda, MR. Gadelha, IGF-I, insulin and prostate cancer., Arq Bras Endocrinol Metabol, volume 53, issue 8, pages 969-75, Nov 2009, PMID 20126849
- ↑ AW. Hsing, YT. Gao, S. Chua, J. Deng, FZ. Stanczyk, Insulin resistance and prostate cancer risk., J Natl Cancer Inst, volume 95, issue 1, pages 67-71, Jan 2003, PMID 12509402
- ↑ A. W. Hsing, S. Chua, Y.-T. Gao, E. Gentzschein, L. Chang, J. Deng, F. Z. Stanczyk, Prostate Cancer Risk and Serum Levels of Insulin and Leptin: a Population-Based Study, JNCI Journal of the National Cancer Institute, volume 93, issue 10, 2001, pages 783–789, ISSN 0027-8874, doi 10.1093/jnci/93.10.783
- ↑ DB. Boyd, Insulin and cancer., Integr Cancer Ther, volume 2, issue 4, pages 315-29, Dec 2003, doi 10.1177/1534735403259152, PMID 14713323
- ↑ Thomas M. S. Wolever, Christine Mehling, High-carbohydrate–low-glycaemic index dietary advice improves glucose disposition index in subjects with impaired glucose tolerance, British Journal of Nutrition, volume 87, issue 05, 2007, pages 477–487, ISSN 0007-1145, doi 10.1079/BJN2002568
- ↑ DM. Nathan, MB. Davidson, RA. DeFronzo, RJ. Heine, RR. Henry, R. Pratley, B. Zinman, Impaired fasting glucose and impaired glucose tolerance: implications for care., Diabetes Care, volume 30, issue 3, pages 753-9, Mar 2007, doi 10.2337/dc07-9920, PMID 17327355
- ↑ Nidhi Bansal, Prediabetes diagnosis and treatment: A review, World Journal of Diabetes, volume 6, issue 2, 2015, pages 296, ISSN 1948-9358, doi 10.4239/wjd.v6.i2.296
- ↑ 23.0 23.1 SM. Grundy, Pre-diabetes, metabolic syndrome, and cardiovascular risk., J Am Coll Cardiol, volume 59, issue 7, pages 635-43, Feb 2012, doi 10.1016/j.jacc.2011.08.080, PMID 22322078
- ↑ T. Nishida, S. Tsuji, M. Tsujii, S. Arimitsu, Y. Haruna, E. Imano, M. Suzuki, T. Kanda, S. Kawano, Oral glucose tolerance test predicts prognosis of patients with liver cirrhosis., Am J Gastroenterol, volume 101, issue 1, pages 70-5, Jan 2006, doi 10.1111/j.1572-0241.2005.00307.x, PMID 16405536
- ↑ Diego García-Compeán, Subclinical abnormal glucose tolerance is a predictor of death in liver cirrhosis, World Journal of Gastroenterology, volume 20, issue 22, 2014, pages 7011, ISSN 1007-9327, doi 10.3748/wjg.v20.i22.7011
- ↑ R. Vrolix, RP. Mensink, Variability of the glycemic response to single food products in healthy subjects., Contemp Clin Trials, volume 31, issue 1, pages 5-11, Jan 2010, doi 10.1016/j.cct.2009.08.001, PMID 19737630
- ↑ S. Vega-López, LM. Ausman, JL. Griffith, AH. Lichtenstein, Interindividual variability and intra-individual reproducibility of glycemic index values for commercial white bread., Diabetes Care, volume 30, issue 6, pages 1412-7, Jun 2007, doi 10.2337/dc06-1598, PMID 17384339
- ↑ David Zeevi, Tal Korem, Niv Zmora, David Israeli, Daphna Rothschild, Adina Weinberger, Orly Ben-Yacov, Dar Lador, Tali Avnit-Sagi, Maya Lotan-Pompan, Jotham Suez, Jemal Ali Mahdi, Elad Matot, Gal Malka, Noa Kosower, Michal Rein, Gili Zilberman-Schapira, Lenka Dohnalová, Meirav Pevsner-Fischer, Rony Bikovsky, Zamir Halpern, Eran Elinav, Eran Segal, Personalized Nutrition by Prediction of Glycemic Responses, Cell, volume 163, issue 5, 2015, pages 1079–1094, ISSN 00928674, doi 10.1016/j.cell.2015.11.001
- ↑ O. W. Rasmussen, F. F. Lauszus, K. Hermansen, Effects of Postprandial Exercise on Glycemic Response in IDDM Subjects: Studies at constant insulinemia, Diabetes Care, volume 17, issue 10, 1994, pages 1203–1205, ISSN 0149-5992, doi 10.2337/diacare.17.10.1203
- ↑ JW. Van Dijk, RJ. Manders, EE. Canfora, WV. Mechelen, F. Hartgens, CD. Stehouwer, LJ. Van Loon, Exercise and 24-h glycemic control: equal effects for all type 2 diabetes patients?, Med Sci Sports Exerc, volume 45, issue 4, pages 628-35, Apr 2013, doi 10.1249/MSS.0b013e31827ad8b4, PMID 23507836
- ↑ NG. Boulé, E. Haddad, GP. Kenny, GA. Wells, RJ. Sigal, Effects of exercise on glycemic control and body mass in type 2 diabetes mellitus: a meta-analysis of controlled clinical trials., JAMA, volume 286, issue 10, pages 1218-27, Sep 2001, PMID 11559268
- ↑ N. J. Snowling, W. G. Hopkins, Effects of Different Modes of Exercise Training on Glucose Control and Risk Factors for Complications in Type 2 Diabetic Patients: A meta-analysis, Diabetes Care, volume 29, issue 11, 2006, pages 2518–2527, ISSN 0149-5992, doi 10.2337/dc06-1317
- ↑ http://nutritiondata.self.com/topics/glycemic-index, http://nutritiondata.self.com/topics/glycemic-index, Accessed on 13 February 2016
