Muscle Oxygen Saturation (SmO2)
A new type of running sensor has come onto the market in the last few years that will determine the oxygen saturation of blood flowing through the muscles, called [[SmO2]]. Having used the Moxy sensor since 2015, along with the BSX and Humon, I've failed to find much value.
Contents
1 Introduction
You may be familiar with Pulse Oximeters that measure the oxygen saturation of blood flowing through your extremities, called SpO2. In healthy individuals at low altitude, finger SpO2 should remain high, typically above 95%, and this doesn't typically vary with exercise. Also, pulse oximeters are very sensitive to movement, and can't really be used during exercise. Muscle oxygen sensors use similar principles of light absorption, but measure the blood flow deeper in the tissues, and are relatively unaffected by movement. [[SmO2]] varies substantially with exercise, though this pattern is not a simple relationship between saturation and exercise intensity. Instead, [[SmO2]] is often lower at rest than during moderate exercise, falling again as intensity increases. Using a muscle oxygen sensor to evaluate exercise intensity is tricky at best, though it can provide some fascinating insight into how the body is responding. I don't think these sensors are of much value to the average runner, and I'd urge caution before buying one to ensure that you fully understand how they work and their limitations. The current SmO2 sensor is Moxy, as BSX is discontinued, and Humon has not been released yet.
2 Other Metrics
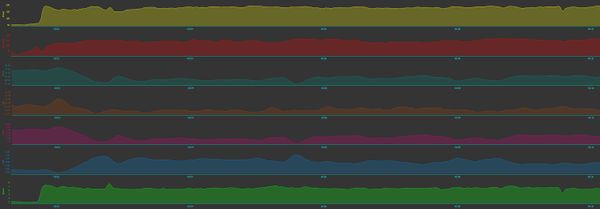
Muscle oxygen sensors can also estimate blood flow (total hemoglobin, tHb), which also changes with exercise intensity. This is the amount of hemoglobin is measured in grams per deciliter of tissue. Given tHb and [[SmO2]] it's possible to calculate the relative volume of oxygenated hemoglobin (O2Hb) which is [[SmO2]]% * tHb. Then there's deoxygenated hemoglobin (HHb), which is tHb - O2Hb. Golden Cheetah does these calculations automatically. It's worth remembering that tHb and the derived metrics are influenced by the fat layer between the sensor and the muscle which are in the light path, so more fat will produce a lower value. This means that the tHb values should be considered relative, and positioning the sensor in a slightly different place can result in a different range of values. If you look at the chart below, at the top you'll see the Stryd power estimate in yellow jumps up as I go from walking to running at the start of my warmup. Next is Heart Rate in red, climbing as expected. SmO2 in gray-green drops, then fluctuates slightly, showing the increased oxygen demand from the muscles. Surprisingly (to me at least), the brown tHb rises initially, then drops off. The calculated values show there's a lot less O2Hb and a lot more HHb. That's what you'd expect, as the muscles are pulling more O2 from the blood.
3 Uses
So, while muscle oxygen sensors are fascinating, are they useful? At the moment, there is insufficient research to have a clear answer to this seemingly simple question. So far, I've seen a number of potential uses for muscle oxygen sensors, but I'm not convinced they are compelling enough to justify the cost for the vast majority of runners.
3.1 Lactate Threshold Testing
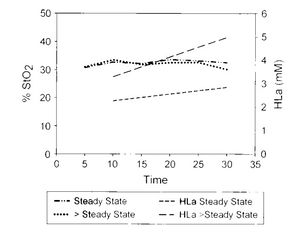
It's hard to determine Lactate Threshold. They are a wide variety of definitions of lactate threshold, and a variety of testing protocols. Many of these protocols use an incremental stress test, though the gold standard of Maximum Lactate Steady State requires several steady-state runs. Lactate threshold testing also normally requires a blood sample and relatively expensive test strips. There are initial indications that muscle oxygen sensors might be able to determine lactate threshold unintrusively, but I'm a little doubtful as I dig deeper. If you look at the chart below, there does not appear to be a difference in SmO2 during an MLSS test above and below the MLSS threshold pace[1]. If running above the MLSS threshold pace does not result in a drop in smo2, then the ability to use SmO2 for finding threshold seems rather dubious.
Perhaps more importantly, the value of knowing your lactate threshold may be overstated. While it's a useful predictor of race performance, the majority of research suggests that Tempo Runs are ineffective, which is one of the common uses of knowing lactate threshold.
3.2 Defining Warmup
There is no clear definition of what constitutes adequate warm-up. There are increases in core temperature, muscle temperature, blood flow, as well as changes to the metabolism of fuel sources[2][3]. It seems reasonable that the change in blood flow might be detected via a SmO2 and tHb. However, I've found a variety of patterns during warm-up, and I couldn't find any research that provides usable insights. It was a little surprising to me to discover that SmO2 at rest can be quite low. This is in contrast to SpO2 that is close to 100% in healthy individuals. I believe that this is because the blood supply to the muscles is sufficient to keep them adequately oxygenated, but nothing more. This means that typically SmO2 will rise during warm-up, though this will depend somewhat on how active you've been before you start your workout. If we consider tHb as a proxy for blood supply, you'd expect this to steadily rise during warm-up, but yet again, I see a variety of patterns. Sometimes tHb will steadily rise, but other times the responses are a little more jagged. There may be some dependency on sensor positioning, as different muscles are likely to have different warm-up profiles.
3.3 High Intensity Interval Training
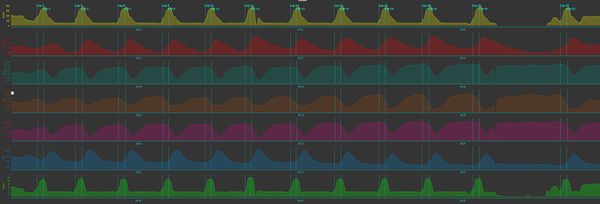
High Intensity Interval Training (HIIT) is where I find the most value in a muscle oxygen sensor. I like to use Stryd to give me an estimate of running power, as this is a good absolute measure of my intensity during the interval. I also like to get some insight into how my body is responding to the stress of the interval, and generally heart rate responds too slowly. The graph below is from a HIIT session using 10 second "all out" repeats with near-full recovery. The top line in yellow shows power, and you can see I stopped briefly between the penultimate and last interval to talk to a friend. The red heart rate line shows how far behind the high intensity running my heart rate is lagging, with the peak heart rate coming well after I stopped running. That's really not surprising given the intervals are only lasting 10 seconds. You'll also notice how the peak becomes more rounded is the intervals progress, showing the increase in fatigue. The gray-green line shows SmO2, and you can see that it lags even further behind than heart rate, but you'll notice I'm not able to drop my SmO2 as low in the later intervals even though I seem to be generating similar levels of power. Blood flow (tHb in brown) drops during the interval and recovers well before I start running again. As a consequence, the amount of oxygenated blood shown in purple drops after the interval and the deoxygenated blood rises in a reciprocal fashion.
By by contrast, the graph below is from a WinTab workout, which uses Tabata structure of 20 second intervals with 10 second recoveries repeated eight times, but uses the Wingate "all out" intensity rather than a true Tabata that would use 170% of the workload at V̇O2max. With this style of workout, you can see a gradual rise in heart rate, with relatively little drop in the short intervals. SmO2 drops and stays fairly low during the workout, but tHb seems to rise slightly. The level of oxygenated blood drops, but the clearest indication of workload is the rise in deoxygenated blood.
4 Sensor Placement
Because an SM sensor measures just a small area of the muscle directly under the sensor, you can get different readings due to fairly minor repositioning of the sensor. In most of my experiments this is not a huge difference in SmO2 values, but because tHb is affected by superficial fat levels, you can get quite different absolute readings for different positions. The relative changes in tHb seem to remain fairly stable. One exception is if you place the sensor near the ITB, as the ITB will block the sensor if the ITB is in the way, resulting in intermittent readings. Placing the sensor on the quads seems to be a good option, as the quads are highly used while running. The calf muscles are less than ideal because the calf engagement can vary with foot strike and pace, creating a misleading picture. Unless of course, you're just trying to understand the cough, not the whole runner. I've not experimented much with the hamstrings or glutes, but I may do so in the future.
5 References
- ↑ AC. Snyder, MA. Parmenter, Using near-infrared spectroscopy to determine maximal steady state exercise intensity., J Strength Cond Res, volume 23, issue 6, pages 1833-40, Sep 2009, doi 10.1519/JSC.0b013e3181ad3362, PMID 19675475
- ↑ David Bishop, Warm Up I, Sports Medicine, volume 33, issue 6, 2003, pages 439–454, ISSN 0112-1642, doi 10.2165/00007256-200333060-00005
- ↑ David Bishop, Warm Up II, Sports Medicine, volume 33, issue 7, 2003, pages 483–498, ISSN 0112-1642, doi 10.2165/00007256-200333070-00002


