Difference between revisions of "VO2 Kinetics"
User:Fellrnr (User talk:Fellrnr | contribs) (Created page with "The time it takes for oxygen delivery to respond to the demands of exercise is called "V0<sub>2</sub> kinetics". The diagram below shows what happens when we start running from a...") |
User:Fellrnr (User talk:Fellrnr | contribs) m |
||
| Line 1: | Line 1: | ||
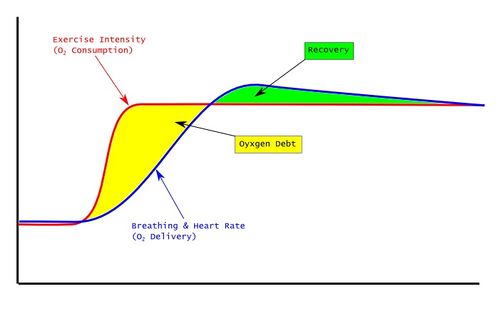
The time it takes for oxygen delivery to respond to the demands of exercise is called "V0<sub>2</sub> kinetics". The diagram below shows what happens when we start running from an initial standstill without any warm-up. The red line represents our exercise level as oxygen consumption, and it rises rapidly to a steady-state that represents the demands of the running pace. The blue line on the other hand represents the rate of oxygen delivery which is mostly controlled by breathing and heart rate. As you can see the oxygen delivery lags behind the oxygen consumption and this creates an oxygen debt represented by the yellow area. This oxygen debt does not cause a drop in the oxygen saturation of our blood (hypoxia), but rather forces our body to produce energy anaerobically (literally without oxygen). Our body will attempt to repay this oxygen debt by providing more oxygen as shown in the green area. The imbalance caused by the oxygen debt and the anaerobic energy production can actually last for protracted time and results in excessive [[Glycogen]] consumption causing problems on longer races such as marathons. Improved fitness from training will reduce the time it takes for the body to ramp up O<sub>2</sub> delivery. | The time it takes for oxygen delivery to respond to the demands of exercise is called "V0<sub>2</sub> kinetics". The diagram below shows what happens when we start running from an initial standstill without any warm-up. The red line represents our exercise level as oxygen consumption, and it rises rapidly to a steady-state that represents the demands of the running pace. The blue line on the other hand represents the rate of oxygen delivery which is mostly controlled by breathing and heart rate. As you can see the oxygen delivery lags behind the oxygen consumption and this creates an oxygen debt represented by the yellow area. This oxygen debt does not cause a drop in the oxygen saturation of our blood (hypoxia), but rather forces our body to produce energy anaerobically (literally without oxygen). Our body will attempt to repay this oxygen debt by providing more oxygen as shown in the green area. The imbalance caused by the oxygen debt and the anaerobic energy production can actually last for protracted time and results in excessive [[Glycogen]] consumption causing problems on longer races such as marathons. Improved fitness from training will reduce the time it takes for the body to ramp up O<sub>2</sub> delivery. | ||
| − | [[File:Warmup.jpg|none|thumb|500px|A graph of V0<sub>2</sub> kinetics.]] | + | [[File:Warmup.jpg|none|thumb|500px|A graph of V0<sub>2</sub> kinetics when going from rest to high intensity exercise.]] |
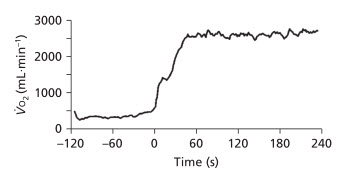
Below is a graph of Paula Radcliffe's O<sub>2</sub> consumption as she goes from rest to running a 6:00 min/mile pace. Notice how her O<sub>2</sub> consumption stabilizes with 45 seconds with no noticeable oxygen debt or recovery. | Below is a graph of Paula Radcliffe's O<sub>2</sub> consumption as she goes from rest to running a 6:00 min/mile pace. Notice how her O<sub>2</sub> consumption stabilizes with 45 seconds with no noticeable oxygen debt or recovery. | ||
[[File:PR VO2 Kinetics.jpg|none|thumb|500px|Paula Radcliffe's V0<sub>2</sub> kinetics.]] | [[File:PR VO2 Kinetics.jpg|none|thumb|500px|Paula Radcliffe's V0<sub>2</sub> kinetics.]] | ||
Revision as of 18:04, 28 December 2011
The time it takes for oxygen delivery to respond to the demands of exercise is called "V02 kinetics". The diagram below shows what happens when we start running from an initial standstill without any warm-up. The red line represents our exercise level as oxygen consumption, and it rises rapidly to a steady-state that represents the demands of the running pace. The blue line on the other hand represents the rate of oxygen delivery which is mostly controlled by breathing and heart rate. As you can see the oxygen delivery lags behind the oxygen consumption and this creates an oxygen debt represented by the yellow area. This oxygen debt does not cause a drop in the oxygen saturation of our blood (hypoxia), but rather forces our body to produce energy anaerobically (literally without oxygen). Our body will attempt to repay this oxygen debt by providing more oxygen as shown in the green area. The imbalance caused by the oxygen debt and the anaerobic energy production can actually last for protracted time and results in excessive Glycogen consumption causing problems on longer races such as marathons. Improved fitness from training will reduce the time it takes for the body to ramp up O2 delivery.
Below is a graph of Paula Radcliffe's O2 consumption as she goes from rest to running a 6:00 min/mile pace. Notice how her O2 consumption stabilizes with 45 seconds with no noticeable oxygen debt or recovery.

