Difference between revisions of "Slowing up at Weymouth Woods 100K"
User:Mediawiki (User talk:Mediawiki | contribs) |
User:Fellrnr (User talk:Fellrnr | contribs) m |
||
| (One intermediate revision by the same user not shown) | |||
| Line 1: | Line 1: | ||
Weymouth Woods 100K is unusual for an ultra because it is a lap course with chip timing. This gives accurate timing for each of the 14 laps, which were nicely published for some number crunching. | Weymouth Woods 100K is unusual for an ultra because it is a lap course with chip timing. This gives accurate timing for each of the 14 laps, which were nicely published for some number crunching. | ||
| − | Looking at the [http://www.etinternet.net/%7Erunrbike/WeymouthWoodsLapSplits100K.htm split times][http://www.etinternet.net/~runrbike/WeymouthWoodsLapSplits100K.htm, ,] it is immediately obvious that people slow up in the race. But does everyone? And by how much? I pulled the split times (via some custom | + | Looking at the [http://www.etinternet.net/%7Erunrbike/WeymouthWoodsLapSplits100K.htm split times][http://www.etinternet.net/~runrbike/WeymouthWoodsLapSplits100K.htm, ,] it is immediately obvious that people slow up in the race. But does everyone? And by how much? I pulled the split times (via some custom [[Excel Macros for pace]]) into Excel and did some graphing to find out... |
| − | |||
== Absolute Times == | == Absolute Times == | ||
| − | + | [[File:768651953_edUQc-O.jpg]] | |
| − | |||
This graph shows the time taken for each lap (in seconds), with each line as a different runner. You can see that the time difference between the fastest and slowest runners grows as the race progresses. Initially there is about 2,000 seconds between the fastest and slowest, but at the end, the gap grows to 5,000. | This graph shows the time taken for each lap (in seconds), with each line as a different runner. You can see that the time difference between the fastest and slowest runners grows as the race progresses. Initially there is about 2,000 seconds between the fastest and slowest, but at the end, the gap grows to 5,000. | ||
== Relative Times == | == Relative Times == | ||
| − | + | [[File:768652202_jt5qT-O.jpg]] | |
| − | |||
For this graph, I worked out each runners average lap time, then divided each lap by the average. This graph then shows how much faster or slower a runner completes each lap compared with their average. A runner who runs even splits would be a flat line, a runner how slows up will be an upward facing line, and if any runner had done negative splits (got faster), the line would slope downward. | For this graph, I worked out each runners average lap time, then divided each lap by the average. This graph then shows how much faster or slower a runner completes each lap compared with their average. A runner who runs even splits would be a flat line, a runner how slows up will be an upward facing line, and if any runner had done negative splits (got faster), the line would slope downward. | ||
| Line 30: | Line 27: | ||
Looking at the WW100K, the variation in finish time does not dramatically go up with the finishing place. | Looking at the WW100K, the variation in finish time does not dramatically go up with the finishing place. | ||
| − | + | [[File:768673366_648jK-O.jpg]] | |
(Plot of standard deviation against finishing place.) | (Plot of standard deviation against finishing place.) | ||
Note - the spreadsheet is available on request - just email spreadsheet@fellrnr.info and I'll send it to you. | Note - the spreadsheet is available on request - just email spreadsheet@fellrnr.info and I'll send it to you. | ||
Latest revision as of 05:07, 23 January 2012
Weymouth Woods 100K is unusual for an ultra because it is a lap course with chip timing. This gives accurate timing for each of the 14 laps, which were nicely published for some number crunching.
Looking at the split times, it is immediately obvious that people slow up in the race. But does everyone? And by how much? I pulled the split times (via some custom Excel Macros for pace) into Excel and did some graphing to find out...
Contents
1 Absolute Times
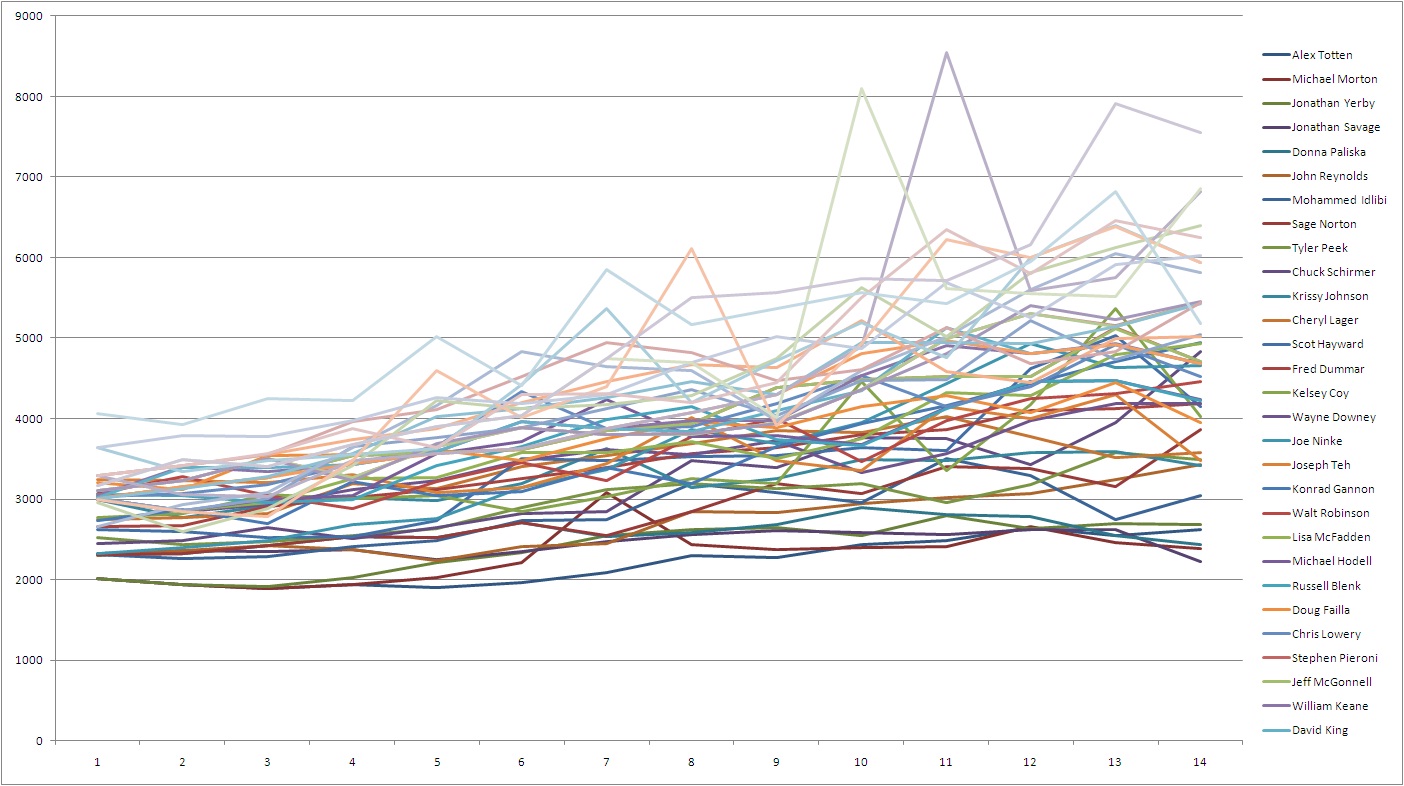
This graph shows the time taken for each lap (in seconds), with each line as a different runner. You can see that the time difference between the fastest and slowest runners grows as the race progresses. Initially there is about 2,000 seconds between the fastest and slowest, but at the end, the gap grows to 5,000.
2 Relative Times
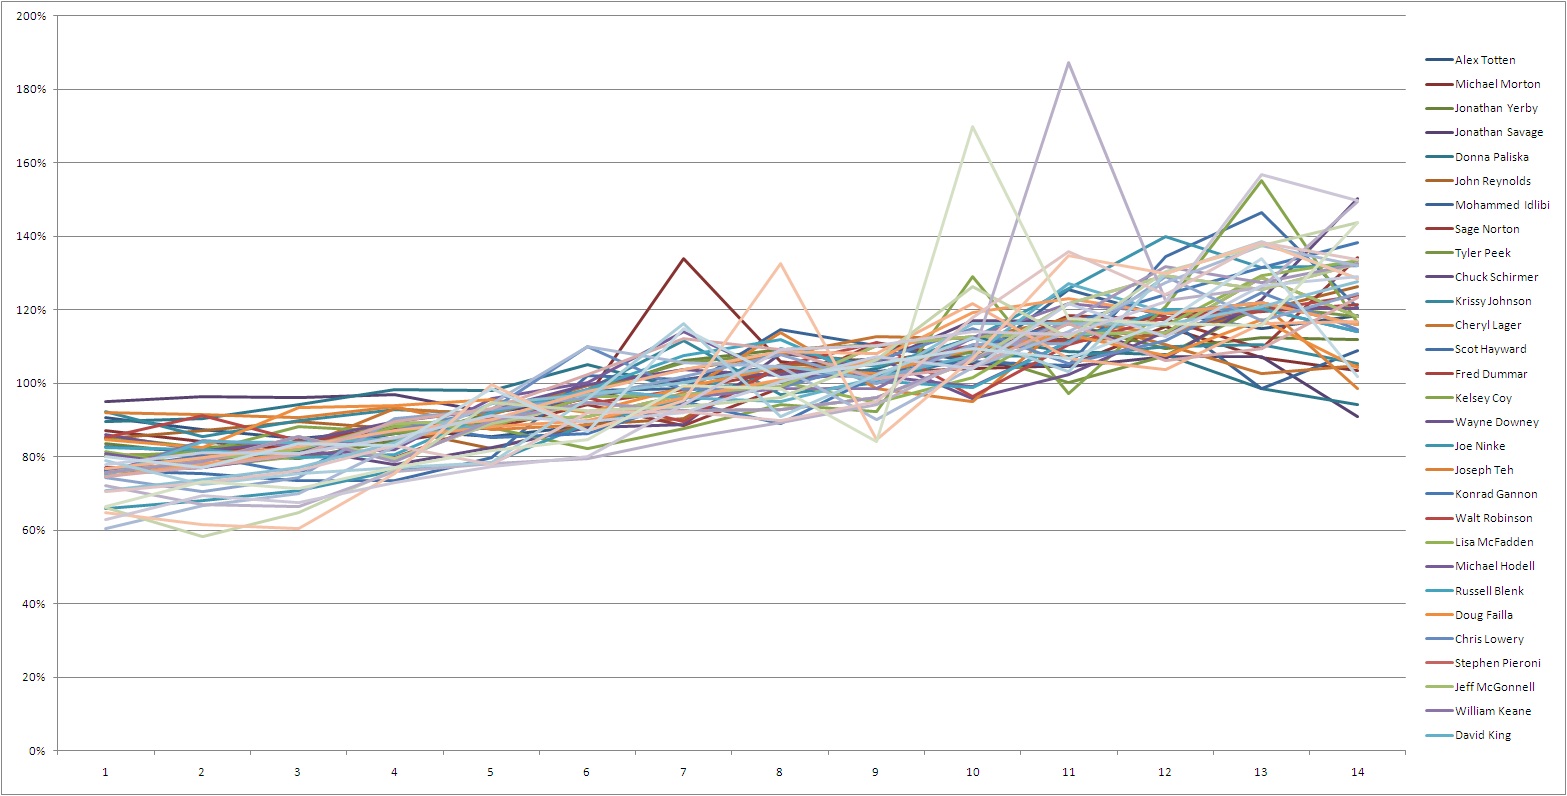
For this graph, I worked out each runners average lap time, then divided each lap by the average. This graph then shows how much faster or slower a runner completes each lap compared with their average. A runner who runs even splits would be a flat line, a runner how slows up will be an upward facing line, and if any runner had done negative splits (got faster), the line would slope downward.
This graph shows a much more consistent picture, with each runner slowing up as the race progresses. Most runners start off between 5% and 40% faster than there average, and end up between their average and 50% slower. (Two runners, Donna and I, did our last lap faster than average.)
3 Slow Down - The Extremes
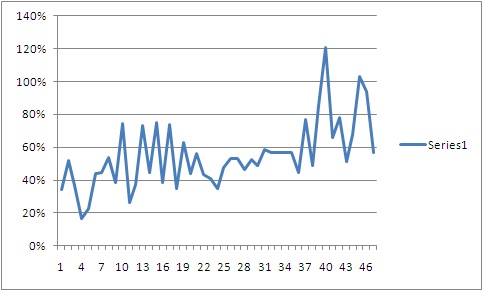
Looking at the fastest and slowest lap times, the average slowdown is 55%. The least anyone slowed down was 17% and the most was 121%. Of course, the slowest lap can easily be a rogue value, as you can see from some of the spikes in the graphs above.
4 Slow Down - The Standard Deviation
The standard deviation is how much things vary from the average. Making lots of assumptions, about 68% of laps would be within one standard deviation of the average, and about 95% of lap times within twice that value. So the average standard deviation is 17%. That means that most people's lap times slowed down by about 34%.
5 What does it mean?
That's the really hard question to answer. Is slowing down A Bad Thing, or an optimal strategy? Conventional wisdom is to run close to even splits, but I don't know of any study to show this works best.
Looking at the WW100K, the variation in finish time does not dramatically go up with the finishing place.
 (Plot of standard deviation against finishing place.)
Note - the spreadsheet is available on request - just email spreadsheet@fellrnr.info and I'll send it to you.

