Glycogen
Our bodies store carbohydrate as glycogen, the critical fuel supply for endurance running.
Contents
1 Introduction
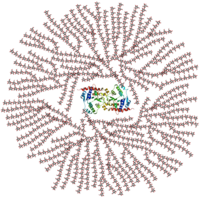
While the human body has sufficient stores of fat to run vast distances, the supply of carbohydrate is quite limited. This carbohydrate store is in the form of Glycogen, a branching chain of glucose molecules.
- Burning glycogen for energy requires less oxygen than fat, making it more efficient. However, the store of glycogen is limited, and when the supply runs low, we "hit the wall".
- Glycogen is stored primarily in the muscles, but that glycogen can only be used by the muscle it's stored in and cannot flow from the muscles through the blood to other places. The glycogen is stored within a muscle fiber, not the overall muscle, so when a fiber gets glycogen depleted, it can't use glycogen from surrounding fibers.
- Some glycogen is stored in the liver where it flows through the blood to all tissues. The human liver typically stores between 90 and 160 grams of Glycogen, or 350 to 650 Calories.
- Blood typically contains less than 20 calories of glucose. (This assumes 5 liters of blood and 100mg/dL of blood glucose, which is 5g of glucose.)
- Glycogen can also be created from Protein via a process called gluconeogenesis, but not from fat.
- Eccentric exercise, such as Downhill Running, can cause DOMS and impair glycogen replenishment[1].
- Glycogen stores may not be replenished between daily hard runs, such as 10 miles at 80% of V̇O2max[2].
- Each gram of Glycogen is stored with between 3-4g of water[3]. This means you can lose a lot of weight rapidly after long runs or brief diets, but this is mostly water weight. This water can provide hydration, offset sweating or increasing urine volumes. Consequently, you may need less fluid earlier in a run compared with later.
- High Intensity Interval Training may deplete glycogen reserves rapidly. This is anerobic exercise only produces 1/15 the energy from glycogen, so the typical 2,000 calories energy reserve would only give 133 calories!
2 Glycogen Usage
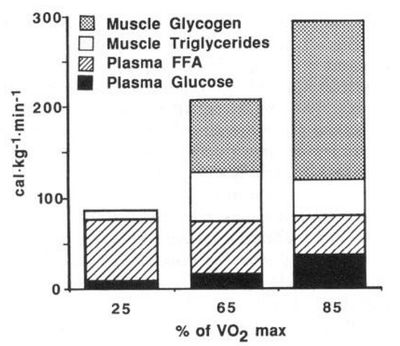 The contribution of different energy sources changes[4] with exercise intensity. These values were taken after 30 min. of exercise. Note that the total calories available from the blood (free fatty acid and glucose) remains about the same regardless of exercise intensity. |
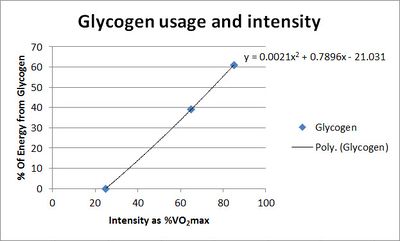 Percentage of energy from glycogen plotted against exercise intensity as percentage of V̇O2max. |
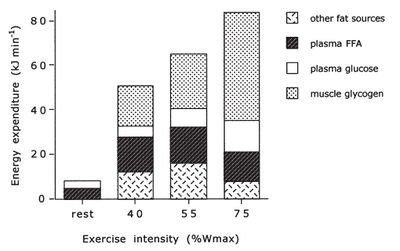 Another study also looked at the utilization of different energy sources during exercise and produced similar results[5]. |
At low exercise intensity the majority of the energy comes from free fatty acids in the blood, with a little bit of blood glucose and a little bit of muscle triglyceride. As the exercise intensity increases the contribution of free fatty acids drops. The contribution of blood glucose increases with exercise intensity, but not as dramatically as the contribution of muscle glycogen. At higher intensity muscle glycogen is the major energy source and is critical for performance.
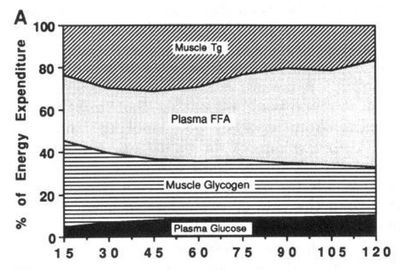
At 65% V̇O2max, the usage of different substrates changes over time. The reduced usage of muscle glycogen may be due to a reduction in the availability of the glycogen. Over the two hour period shown, the fat:carbohydrate ratio changes from around 55:45 to 65:35. This change would reduce power output (running speed) at the fixed percentage of V̇O2max (see 'Glycogen Depletion and Breathing' below).
3 Glycogen Depletion
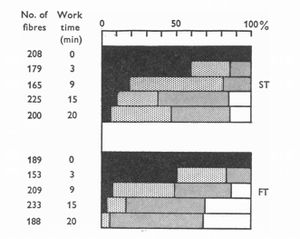
The chart[6] below shows that muscles do not become glycogen depleted at the same time. At all intensities shown, slow twitch fibers become depleted before fast twitch. The depletion within a fiber type is also not equivalent, with some fibers becoming depleted while others are fully loaded. This pattern implies a pattern of Muscle Recruitment, where a subset of muscle fibers are recruited until they become exhausted, at which point other fibers are then used. As the slow twitch fibers become exhausted, fast twitch fibers are used in turn.
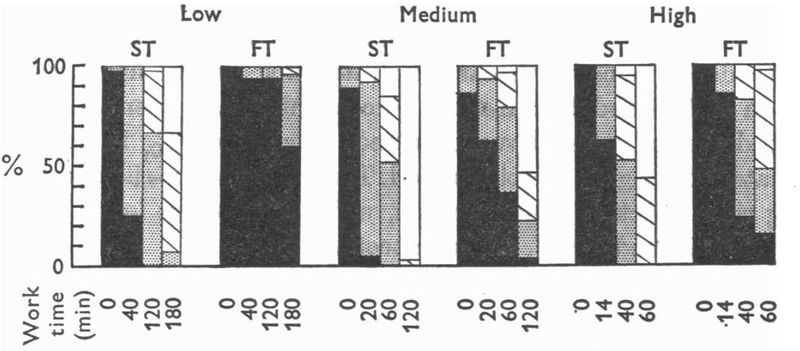
The depletion of glycogen within slow twitch fibers results in the recruitment of fast twitch fibers[7].
4 Glycogen Depletion and Breathing Rate
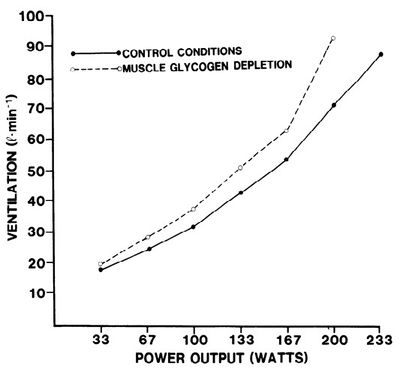
It requires more oxygen to produce energy from fat than carbohydrate[8]. This may be why higher intensity exercise harder shifts to burning more carbohydrate. When our muscles become depleted of glycogen, muscles are forced to burn more fat. At any given exercise intensity, we will use more oxygen when we are glycogen depleted. This means our Heart Rate will be higher and out Breathing will be deeper and faster. It also means our perceived exertion is much higher for a given pace when glycogen depleted. This effect is most noticeable at the end of a long run or a marathon race, and it becomes much harder to stay on target pace. In fact, it can become up to 20% harder and this can be the difference between relaxed easy Breathing and panting for breath. This increased demand for oxygen can often be seen in the calculated running efficiency. In addition, the amount of O2 that is extracted from the air is lower with glycogen depletion, probably because breathing rate is driven by CO2 concentrations[9].
5 Glycogen Depletion at High Intensities
High Intensity (anerobic) exercise can deplete Glycogen rapidly. This is because glucose gives 2 ATP anaerobically rather than 30 ATP aerobically, producing only 1/15th the energy. It seems that glycogen is restored after exercise, but this may be from muscle breakdown rather than a reverse conversion of lactate to glycogen.
5.1 Glycogen Depletion during HIIT
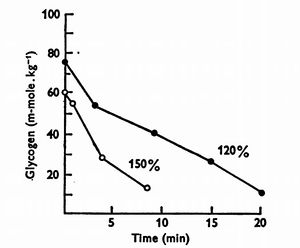
The charts below are based on two HIIT sessions, one at 120% V̇O2max the other at 150% V̇O2max[6]. Notice that the Glycogen depletion reflects the anerobic metabolism, resulting in far less energy (ATP) than would be produced aerobically. The lactate level increased dramatically during the exercise. The slow twitch fibers are depleted to a similar level to those at 120 minutes of 30% V̇O2max, 60 minutes at 64% V̇O2max, or 40 minutes at 83% V̇O2max. The fast twitch fibers have greater glycogen depletion than any of the sub-maximal intensities at any time.
Similar things have been seen with HIIT. One meta-analysis found that HIIT is the most effective way of depleting glycogen[10], thought the analysis did not cover many different protocols.
5.2 Estimating Glycogen Depletion During HIIT
Assuming that you have 500g of muscle Glycogen, that would normally provide about 2,000 Kcal (Calories) aerobically. However, anaerobically that Glycogen will only provide 1/15 of the energy, which is 133 Kcal. It's estimated that humans use 10.8 ml/min of O2 per watt[11], and a liter of O2 is 5Kcal[12], so that works out to 10.8/1000*5=0.054 Kcal/w/min. If you do intervals at 100w above Critical Power, that would burn through the 133 Kcal in (133Kcal/(0.054*100w), or about 25 minutes. At 150w above Critical Power, that drops to about 16 minutes. This is probably best performed as part of HIIT.
5.3 Glycogen Restoration after High Intensity Exercise
The glycogen depletion during HIIT seems largely due to the incomplete metabolism of glucose, resulting in lactate accumulation while producing far fewer calories than complete metabolism. The implications of this depend on how much glycogen is replenished from the conversion of lactate back to Glycogen.
- A study found that 2 minutes of intense exercise resulted in a large drop in Glycogen, but over the following 30 minutes, much of this was restored[13].
- A study of six subjects of wildly varying training status were evaluated for glycogen status after HIIT[14]. The HIIT protocol was 1 minute at 140% V̇O2max with 3-minute rests, repeated until the 140% could not be maintained for 30 seconds. The intervals reduced Glycogen stores to 28% of the starting value, and after two hours (fasted) the glycogen stores had only rebounded by ~10% (visual estimate from the chart.) After five hours, glycogen stores continued to be replenished, even in athletes who were fasted for that period. However, it seems unlikely this would be from lactate, and it's possible it was from protein (muscle) breakdown. (Interestingly, the highest trained subjects were able to maintain the intervals the shortest time, but of course were working much harder in absolute terms.)
- A study used a HIIT protocol of 6 seconds @ around 240% V̇O2max with 30 second rests to exhaustion[15]. On a low carbohydrate diet the glycogen dropped from 181 pre-workout to 64 post, a ~65% drop. In a high carbohydrate diet, it dropped from 540 to 151, a ~72% drop. There was a clear relationship between pre-workout glycogen levels and time to exhaustion.
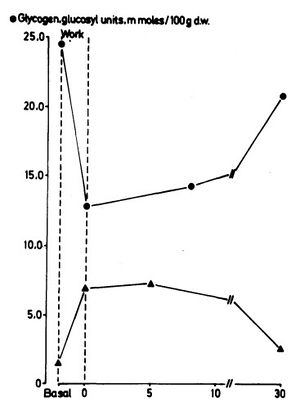
- Seven healthy subjects performed "heavy exercise" which reduced muscle glycogen by 50%, of which 35% was restored during the 60-minute recovery period[16]. The authors concluded that 50% of the lactate was converted to Glycogen in this period, but the study assumes the source of the glycogen is the lactate without tracing the path or considering protein as the source.
- Without sufficient oxygen, lactate rises, but even after oxygen levels are normalized, there's direct evidence from animal models that the lactate is not converted back to glucose or glycogen. In rats, the lactate produced during a 2-3-minute burst of intense exercise is oxidized rather than being converted back to glucose/glycogen[17]. Another study on rats found that less than 20% of lactate gets converted to Glycogen[18]. In a distinctly grim experiment, rats were exercised by tying a weight to their tail and having them swim until too exhausted to stay above the water (~3 minutes) [19]. Some rats had their livers removed prior to the exercise to see how this changed lactate and glycogen responses to the exercise. Glycogen dropped to about 25% (visual estimate from the graph), with the liver-less rats having non-significantly lower glycogen levels. After 30 minutes, both types of rats had restored some of their Glycogen, with the liverless rats being about the same at 30 minutes as the intact rats immediately after exercise. What's all this mean? It suggests that glycogen restoration occurs even without the liver, though having a liver helps. However, it's hard to evaluate the results from tortured animals to voluntary exercise in humans.
6 Glycogen Depletion and Muscle Damage
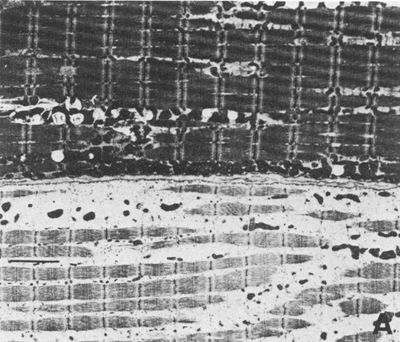
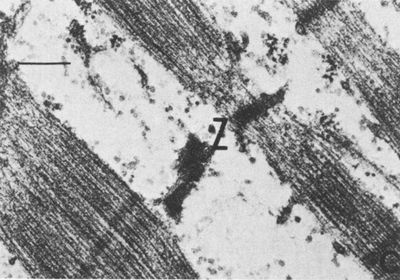
Muscle biopsies taken after a marathon show damage to muscle fibers, but this damage appears focused on a subset of the fibers[20]. Some fibers show no damage, but adjacent fibers are badly affected. The damaged fibers are depleted of Glycogen and lipids (fat). It seems reasonable to me that this pattern of selective damage is due to the pattern of fibers recruitment, with the fibers that are recruited first becoming both glycogen depleted and damaged. Similar damage can be seen with Delayed Onset Muscle Soreness. The images below are taken from the gastrocnemius (calf), 24-48 hours after a marathon race,
7 Glycogen and other fuels
Glycogen is one of several types of fuel the human body can metabolize. Below is a table describing the characteristics of the primary types of fuel[21]. Some important notes:
- Carbohydrate requires less oxygen than fat to produce a calorie of energy.
- Muscles generally burn BCAA[21].
- The ratio of O2 to CO2 is called the respiratory quotient or RQ.
- The figures for fat assume full metabolism rather than a ketogenic state. A ketogenic metabolism of fat can result in an RQ below 0.7[22].
- It is possible for RQ to be above 1.0 if the carbohydrate is converted to fat rather than metabolized[23].
| Fuel Type | Carbohydrate | Protein | Fat | ||
|---|---|---|---|---|---|
| Form | Glucose | Glycogen | Non-BCAA | BCAA | Fatty Acids |
| Oxygen needed per gram (l/g) | 0.75 | 0.83 | 0.965 | 1.24 | 2.02 |
| Energy per gram (Kcal/g) | 3.75 | 4.17 | 4.3 | 3.76 | 9.3 |
| Energy per Liter of Oxygen (Kcal/l O2) | 5.03 | 5.03 | 4.46 | 3.03 | 4.61 |
| Carbon Dioxide produced per gram (l/g) | 0.75 | 0.83 | 0.781 | 0.92 | 1.43 |
| RQ (O2:CO2) | 1.00 | 1.00 | 0.81 | 0.74 | 0.71 |
8 Glycogen Storage and Body Fat Scales (Bioimpedence)
One study[24] concluded that changes in Glycogen storage shouldn't change the way Body Fat Scales estimate fat using bioimpedence. This means that increased Glycogen will result in a lower body fat estimate, as fat mass stays constant and body weight increases[25]. Of course, different scales will use different models that may give different results.
9 References
- ↑ KP. O'Reilly, MJ. Warhol, RA. Fielding, WR. Frontera, CN. Meredith, WJ. Evans, Eccentric exercise-induced muscle damage impairs muscle glycogen repletion., J Appl Physiol, volume 63, issue 1, pages 252-6, Jul 1987, PMID 3624128
- ↑ DL. Costill, R. Bowers, G. Branam, K. Sparks, Muscle glycogen utilization during prolonged exercise on successive days., J Appl Physiol, volume 31, issue 6, pages 834-8, Dec 1971, PMID 5123660
- ↑ Karl-Erik Olsson, Bengt Saltin, Variation in Total Body Water with Muscle Glycogen Changes in Man, Acta Physiologica Scandinavica, volume 80, issue 1, 1970, pages 11–18, ISSN 00016772, doi 10.1111/j.1748-1716.1970.tb04764.x
- ↑ 4.0 4.1 Regulation of endogenous fat and carbohydrate metabolism in relation to exercise intensity and duration http://ajpendo.physiology.org/content/265/3/E380.short
- ↑ Luc J. C. van Loon, Paul L. Greenhaff, D. Constantin-Teodosiu, Wim H. M. Saris, Anton J. M. Wagenmakers, The effects of increasing exercise intensity on muscle fuel utilisation in humans, The Journal of Physiology, volume 536, issue 1, 2001, pages 295–304, ISSN 0022-3751, doi 10.1111/j.1469-7793.2001.00295.x
- ↑ 6.0 6.1 PD. Gollnick, K. Piehl, B. Saltin, Selective glycogen depletion pattern in human muscle fibres after exercise of varying intensity and at varying pedalling rates., J Physiol, volume 241, issue 1, pages 45-57, Aug 1974, PMID 4278539
- ↑ Peter Krustrup, Karin S??Derlund, Magni Mohr, Jens Bangsbo, Slow-Twitch Fiber Glycogen Depletion Elevates Moderate-Exercise Fast-Twitch Fiber Activity and O2 Uptake, Medicine & Science in Sports & Exercise, volume 36, issue 6, 2004, pages 973–982, ISSN 0195-9131, doi 10.1249/01.MSS.0000128246.20242.8B
- ↑ 8.0 8.1 Effect of glycogen depletion on the ventilatory response to exercise http://jap.physiology.org/content/54/2/470.short
- ↑ H. Kyröläinen, T. Pullinen, R. Candau, J. Avela, P. Huttunen, P. V. Komi, Effects of marathon running on running economy and kinematics, European Journal of Applied Physiology, volume 82, issue 4, 2000, pages 297–304, ISSN 1439-6319, doi 10.1007/s004210000219
- ↑ Macklin, Ian; Wyatt, Frank; Ramos, Malaeni; and Ralston, Grant (2019) "Muscle Glycogen Depletion and Replenishment: A Meta-Analytic Review," International Journal of Exercise Science: Conference Proceedings: Vol. 2 : Iss. 11 , Article 10. Available at: https://digitalcommons.wku.edu/ijesab/vol2/iss11/10
- ↑ David P. Swain, Energy Cost Calculations for Exercise Prescription, Sports Medicine, volume 30, issue 1, 2000, pages 17–22, ISSN 0112-1642, doi 10.2165/00007256-200030010-00002
- ↑ Janot, Jeffrey M. "Calculating caloric expenditure." IDEA Fitness Journal 2.6 (2005): 32-33.
- ↑ R. C. Harris, J. Bergström, E. Hultman, The Effect of Propranolol on Glycogen Tabolism During Exercise, volume 11, 1971, pages 301–305, ISSN 0065-2598, doi 10.1007/978-1-4613-4609-8_26
- ↑ J. D. MacDougall, G. R. Ward, J. R. Sutton, Muscle glycogen repletion after high-intensity intermittent exercise, Journal of Applied Physiology, volume 42, issue 2, 1977, pages 129–132, ISSN 8750-7587, doi 10.1152/jappl.1977.42.2.129
- ↑ PD. Balsom, GC. Gaitanos, K. Söderlund, B. Ekblom, High-intensity exercise and muscle glycogen availability in humans., Acta Physiol Scand, volume 165, issue 4, pages 337-45, Apr 1999, doi 10.1046/j.1365-201x.1999.00517.x, PMID 10350228
- ↑ P. O. Astrand, E. Hultman, A. Juhlin-Dannfelt, G. Reynolds, Disposal of lactate during and after strenuous exercise in humans, Journal of Applied Physiology, volume 61, issue 1, 1986, pages 338–343, ISSN 8750-7587, doi 10.1152/jappl.1986.61.1.338
- ↑ H. Hatta, Oxidative removal of lactate after strenuous exercise., Ann Physiol Anthropol, volume 9, issue 2, pages 213-8, Apr 1990, PMID 2400462
- ↑ G. A. Brooks, G. A. Gaesser, End points of lactate and glucose metabolism after exhausting exercise, Journal of Applied Physiology, volume 49, issue 6, 1980, pages 1057–1069, ISSN 8750-7587, doi 10.1152/jappl.1980.49.6.1057
- ↑ S. Nikolovski, D. L. Faulkner, T. N. Palmer, P. A. Fournier, Muscle glycogen repletion from endogenous carbon sources during recovery from high intensity exercise in the fasted rat, Acta Physiologica Scandinavica, volume 157, issue 4, 1996, pages 427–434, ISSN 0001-6772, doi 10.1046/j.1365-201X.1996.507273000.x
- ↑ MJ. Warhol, AJ. Siegel, WJ. Evans, LM. Silverman, Skeletal muscle injury and repair in marathon runners after competition., Am J Pathol, volume 118, issue 2, pages 331-9, Feb 1985, PMID 3970143
- ↑ 21.0 21.1 Sharon A. Plowman, Denise L. Smith, Exercise physiology for health, fitness, and performanc, date 2007, publisher Lippincott Williams Wilkins, location Baltimore, MD, isbn 0-7817-8406-9
- ↑ Y. Schutz, E. Ravussin, Respiratory quotients lower than 0.70 in ketogenic diets., Am J Clin Nutr, volume 33, issue 6, pages 1317-9, Jun 1980, PMID 7386422
- ↑ Michele M. Gottschlich, The science and practice of nutrition support : a case-based core curriculu, date 2001, publisher Kendall/Hunt Pub. Co., location Dubuque, Iowa, isbn 0-7872-7680-4
- ↑ Keisuke Shiose, Yosuke Yamada, Keiko Motonaga, Hideyuki Takahashi, Muscle glycogen depletion does not alter segmental extracellular and intracellular water distribution measured using bioimpedance spectroscopy, Journal of Applied Physiology, volume 124, issue 6, 2018, pages 1420–1425, ISSN 8750-7587, doi 10.1152/japplphysiol.00666.2017
- ↑ Keisuke Shiose, Yosuke Yamada, Keiko Motonaga, Hiroyuki Sagayama, Yasuki Higaki, Hiroaki Tanaka, Hideyuki Takahashi, Segmental extracellular and intracellular water distribution and muscle glycogen after 72-h carbohydrate loading using spectroscopic techniques, Journal of Applied Physiology, volume 121, issue 1, 2016, pages 205–211, ISSN 8750-7587, doi 10.1152/japplphysiol.00126.2016
