The Science Of Hydration
Contents
1 Introduction
The advice given to runners on hydration has changed over time and looks set to continue to change. There are competing forces at work - sports drink manufacturers, event organizers (often sponsored by the manufacturers) and scientists (some also sponsored by the manufacturers). One thing is clear about hydration - it is important. Incorrect hydration can lead to impaired performance, and in extreme cases, death. A condition related to dehydration is Hyponatremia, which is where the sodium (salt) level in the blood becomes too dilute. This is a dangerous condition that has killed a number of runners. This entry is a follow on to Practical Hydration which should be read first.
2 Effects of dehydration
Everyone knows that dehydration is bad. But how bad? Current research indicates that some level of dehydration (up to 3%) does not impact performance, or impacts performance much less than expected[1]. (Dehydration of 5% does impact performance[2].) This may be due to the fact that carbohydrate (Glycogen) is stored with water, in the ratio of about 1g Glycogen to 2.5g water[3]. This means that 2000 calories of Glycogen depletion that are likely to occur in marathon distance runs would result in about 4lb Weight Loss with no reduction in hydration (2000Kcal/4=500g Glycogen + 1250g water = 1750g). In practice moving from a high carbohydrate to high fat diet can see 6lb Weight Loss, believed to be Glycogen + water depletion[3].
3 Sodium loss through sweat
The amount of salt that is lost through sweating varies a lot. It varies from individual to individual, and for an individual it will vary depending on fitness and heat acclimation[4]. This means that you may have to experiment with your salt intake, both during and after exercise.
3.1 Anatomy of Sweating
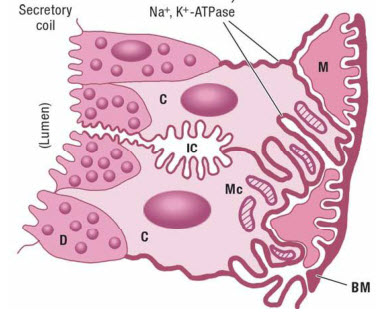
Humans have 2-4 million sweat glands over nearly their whole body surface, and though each is tiny, together they weigh as much as a kidney (~100g)[5]. Sweat glands are most numerous on the soles of the feet. Sweat is produced in two steps[5]:
- A coil generates an ultra-filtrated fluid. This fluid has the same sodium concentration (isotonic) as the blood.
- The fluid travels from the coil up the sweat duct which reabsorbs sodium and chloride (but not potassium). This reabsorption is via active transportation (i.e. it requires energy from ATP). The Glycogen stored in the sweat glands will only support the reabsorption for less than 10 min., so the energy is predominantly supplied by the blood. Glucose is the preferred energy source, though lactate and pyruvate can also be used. Fatty acids, ketones, and amino acids are very poorly used. The reabsorption process also acidifies the final sweat.
The rate of sweat production depends on the local skin temperature and core body temperature. A rise in the localized skin temperature will produce an increased sweat rate within 60 seconds[5].
3.2 Sodium Loss Table
The table below is based on the research showing that sweat sodium concentration increases with sweat rate. The table below is for a runner who is 174cm/70inches high and weighs 60Kg/132lbs, but you can create a customized chart at Sodium Loss. To check your sweat rate, simply weigh yourself before and after a run. Dropping 1 Kg or 2.2 pounds equates to 1 liter of sweating. (Obviously you need to adjust for any fluid intake and avoid urination.)
|
|
|
|
| ||||
|
|
|
|
|
|
|
|
|
|
|
|
|
|
|
|
|
|
|
|
|
22
|
249
|
0.1
|
31
|
355
|
0.2
|
|
|
|
32
|
732
|
0.3
|
46
|
1044
|
0.4
|
|
|
|
43
|
1450
|
0.6
|
61
|
2066
|
0.9
|
|
|
|
53
|
2402
|
1
|
75
|
3423
|
1.5
|
|
|
|
63
|
3589
|
1.5
|
90
|
5113
|
2.2
|
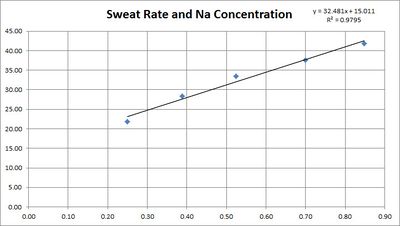
This table is based on the research quoted below showing a linear relationship between sweat rate in sweat sodium concentration.
3.3 Sodium Loss and Sweat Rate
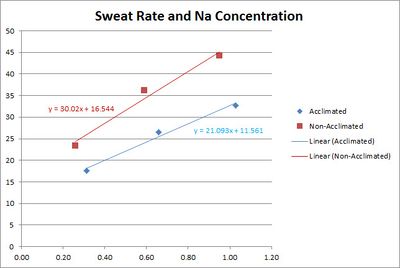
The concentration of sodium in sweat depends on the sweat rate. This is believed to be because the sweat is released with a high sodium concentration, then the sodium is reabsorbed before it reaches the surface. The faster the sweating, the less chance for reabsorption.
3.3.1 Converting per-area sweat rates to whole body sweat rates
We can convert from per-area sweat rates to whole body sweat rates by using a Body Surface Area Calculator. For example, a 135 pound, 70 inch high person has a skin surface area of 1.74 m2, which is 17,400 cm2. Therefore 1 mg/cm2/min is 17,400 mg/min, or 17.4 g/min or 1,044 g/hour, or 1 liter/hour.
3.4 Sodium Loss and Fitness
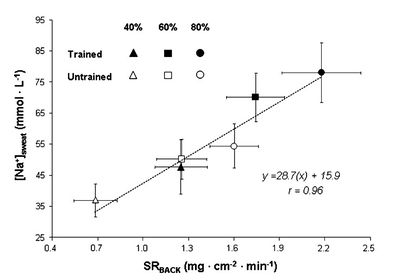
While some sources suggest that increased fitness reduces the sodium concentration in sweat research[8] shows this is not the case. For both trained and untrained individuals sodium concentration depends mainly on sweat rate. In fact, for a given relative intensity (% of V̇O2max) trained individuals will be performing a greater absolute work rate and therefore have a greater sweat rate and sodium concentration.
3.5 Sodium Loss and Heat Acclimation
A study[9] shows that the sodium concentration of sweat is reduced by Heat Acclimation Training. The study used three bouts of 30 min. of exercise in environmental chamber with 10 min. of rest between each bout.
3.6 Sodium Loss and Skin Temperature
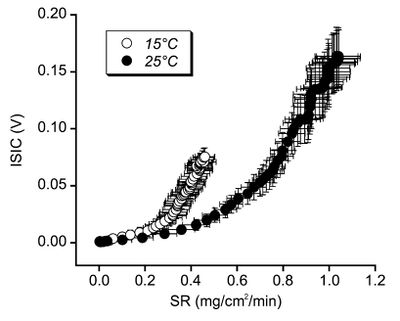
A study[10] of sweating great sodium concentration for different temperatures has shown that sodium reabsorption is greater at high temperatures. Unfortunately the units used in this study are not comparable with other studies. The mechanism behind this is unclear, but the implication is that the sodium concentration of sweat in cooler weather may be higher than expected from the above studies.
4 Sodium Retention
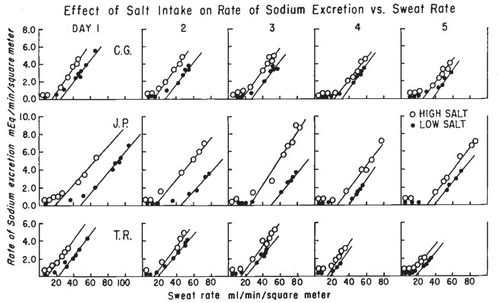
The human body has mechanisms to try to maintaining its sodium balance. Greater sodium intake results in the excess being excreted in the sweat and urine. Conversly, restricted sodium intake will result in a reduction of the sodium concentration of the sweat[11]. This reduction in the sodium concentration occurs at all sweating rates, but the relationship between sodium concentration and sweat rate remains a straight line[12]. So at any given sweat rate, a restricted sodium intake will result in less sodium in the sweat. However, even on a restricted sodium intake, the more you sweat, the greater the sodium concentration. Comparing the maximum sodium concentration of sweat between a salt intake of 500mg/day and 20,000mg/day, the low salt intake reduced the sodium concentration by 30-48%[12].
5 Sodium Intake
Below are some sample sources of Sodium, with the concentrations defined.
| Source | Sodium - mmol per liter | Sodium - grams per liter | Sodium - grams per pint | Salt - grams per pint |
| Gatorade | 18 | 0.4 | 0.2 | 0.5 |
| Water + 1/4 Teaspoon salt per quart | 27 | 0.6 | 0.3 | 0.75 |
| Gatorade+ 1/4 Teaspoon salt per quart | 45 | 1.0 | 0.5 | 1.2 |
| S-Caps + 8oz water* | 65 | 1.4 | 0.7 | 1.7 |
| Salt Stick + 8oz Water | 38 | 0.84 | 0.4 | 0.98 |
| Salt Stick + 16oz Water | 19 | 0.42 | 0.2 | 0.49 |
Note: S-Caps does not specify the amount of fluid to take with each capsule, but does mention 'at least one cup', so this ratio is used. The per-pint and per-liter equivalents assumes a constant ratio of one capsule per 8oz of water. See also Comparison of Gels.
5.1 Example Sodium Losses
Here are some hypothetical examples
- Adam, a heat acclimatized runner, weighs himself before and after his four hour run and the difference is 8 pounds, which is roughly equivalent to 8 pints/4 liters of sweat. Based on 1 liter/hour of sweating we estimate Adam lost 4 grams of sodium, which is about 2 teaspoons.
- Bob is not heat acclimatized runner, and losses 9 pounds in three hours (9 pints/4.5 liters). From the sweat rate we estimate that Bob has lost 7.5 grams of sodium, which is about 3.3 teaspoons.
6 Sweat Rates While Running
Sweat rates in male runners have been measured in the range from 0.75-2.23 in winter to 0.99-2.55 in the summer (Liters per hour)[13]. At the low end, we can imagine a fit runner finishing a 3-hour marathon in winter and sweating only 2.25 Liters. Assuming they are also heat acclimated, they would only lose 2 grams of sodium, which is 5 grams of salt, less than a teaspoon. On the other end of the scale, a fit, but unacclimatized runner completing a 5 hour marathon in summer would sweat out nearly 13 Liters, 18 grams of sodium, which is 45 grams of salt or more than 7 teaspoons. There is a table showing a range of values at Sodium Loss.
7 Hyponatremia
Hyponatremia is where the sodium (salt) levels becomes too dilute. Initial symptoms tend to be a gain in weight and a general swelling and 'puffiness', most noticeable in the hands. More severe symptoms are caused by a swelling of the brain (cerebral edema) including nausea, vomiting, headache and malaise[14].
8 HypERnatremia - the opposite of HypOnatremia
Generally, Hypernatremia (too much sodium in the blood) seems to be a result of dehydration rather than excessive salt intake[15]. It should be noted that taking Electrolyte Capsules bypasses the body's taste. This sense of taste seems to reflect our body's internal sensors; our desire for salty foods reflects our salt requirements.
9 Salt and High Blood Pressure
There is evidence that increased salt intake can increase blood pressure[16], and the common recommendation is to restrict your salt intake if you have high blood pressure. However, a recent study[17] has shown that reducing your salt intake may increase your risk of a heart attack rather than lower it. For more on the health risks of low salt diets see http://www.drmirkin.com/public/ezine050811.html As an aside, if you have low blood pressure, which I do, increasing your salt intake can really help.
10 Caffeine and Alcohol
The scientific evidence shows that Caffeine is generally not a diuretic[18][19][20]. Previous studies have shown that if you don't normally take Caffeine and then get a large dose, there is some diuretic effect. However normal intakes of Caffeine by non-users and use by regular users is not a diuretic[21]. (If you urinate more because you drink a 20oz Latte, it is because of the 20oz of fluid, not the Caffeine.) Alcohol is another story; drinking anything stronger than 2% will cause dehydration. Because alcohol takes 36 hours to clear the body, it should be avoided for 48 hours before you wish to avoid impaired performance[18].
11 Cramps
The evidence for hydration and electrolyte status causing Cramps is somewhat ambiguous, but supplementing your electrolyte intake may help.
12 Blisters and black toe nails
Dehydration reduces body weight, which can reduce the size of your feet. This in turn changes the fit of your Shoes, causing blisters. Hyponatremia can cause swelling, which increases the size of your feet and can cause blisters. Both conditions can also increase the chance of black toe nails.
13 Sodium and Water in the Body[22]
Approximately 60% of the human body weight is water, though this varies primarily with body fat as adipose (fat) tissue contains a lower percentage of water. Total Body Water (TBW) can be divided up into
- Intracellular fluid (ICF) which is 40% of body weight
- Extracellular fluid (ECF) which is the other 20% of body weight
- plasma is 25% of ECF/5% body weight
- interstitial fluid which is 75% of ECF/15% of body weight, typically 11 Liters/22 pints.
The volume of extracellular fluid is typically 15 liters in a 70 kg human, and the 50 grams of sodium it contains is about 90% of the body's total sodium content.
14 Symptoms of Dehydration[22]
These symptoms are for the general public, and there is evidence[23] that they may not apply to athletes suffering from mild dehydration
| symptom | mild dehdration (3-5% body weight) | Moderate dehdration (6-9% body weight) | Severe dehdration (>10% body weight) |
| Level of consciousness | Alert | Lethargic | Obtunded |
| Capillary Refill | 2 seconds | 2-4 seconds | >4 seconds |
| Blood Pressure | Normal | Normal supine, lower standing | lower |
| Skin Turgor | Normal | Slow | Tenting |
| Eyes | Normal | Sunken | Very Sunken |
15 References
- ↑ Hydration - fluid intake advice and tips http://www.pponline.co.uk/encyc/hydration-fluid-intake-advice-and-tips-40789
- ↑ Dehydration reduces cardiac output and increases systemic and cutaneous vascular resistance during exercise http://www.edb.utexas.edu/coyle/pdf%20library/%2863%29%20Dehydration%20reduces%20cardiac%20output%20&%20increases%20systemic%20&%20cutaneous%20vascular%20resistance%20during%20exercise,%20J%20Appl%20Physiol%2079,%201487-96,%201995.pdf
- ↑ 3.0 3.1 The Relation Of Glycogen To Water Storage In The Liver http://www.jbc.org/cgi/reprint/96/2/367.pdf
- ↑ Cracking the Code on Hydration http://www.active.com/cycling/Articles/Cracking-the-Code-on-Hydration.htm
- ↑ 5.0 5.1 5.2 Fitzpatrick's Dermatology in General Medicine, Chapter 81. Biology of Eccrine, Apocrine, and Apoeccrine Sweat Glands
- ↑ Na+ secretion rate increases proportionally more than the Na+ reabsorption rate with increases in sweat rate http://jap.physiology.org/content/105/4/1044.full
- ↑ 7.0 7.1 Comparison of regional patch collection vs. w... [J Appl Physiol. 2009] - PubMed - NCBI http://www.ncbi.nlm.nih.gov/pubmed/19541738
- ↑ SpringerLink - European Journal of Applied Physiology, Volume 111, Number 11 http://www.springerlink.com/content/mxj56211q04v4455/
- ↑ Sodium ion concentration vs. sweat rate relationship in humans http://jap.physiology.org/content/103/3/990.full
- ↑ SpringerLink - European Journal of Applied Physiology, Volume 94, Number 4 http://www.springerlink.com/content/n569w2538g13516r/
- ↑ Relationship between salt intake and sweat salt concentration under conditions of hard work in humid heat http://www.ncbi.nlm.nih.gov/pubmed/20984571
- ↑ 12.0 12.1 12.2 Journal of Investigative Dermatology - The Effect of Salt Intake on Sweat Gland Function1 http://www.nature.com/jid/journal/v50/n6/full/jid196873a.html
- ↑ http://journals.lww.com/acsm-msse/_layouts/oaks.journals/ImageView.aspx?k=acsm-msse:2007:02000:00022&i=TT2
- ↑ Hyponatremia http://en.wikipedia.org/wiki/Hyponatremia
- ↑ Sodium Status of Collapsed Marathon Runners http://arpa.allenpress.com/arpaonline/?request=get-document&doi=10.1043%2F1543-2165%282005%29129%3C227:SSOCMR%3E2.0.CO%3B2
- ↑ Micronutrient Information Center - Sodium http://lpi.oregonstate.edu/infocenter/minerals/sodium/
- ↑ Fatal and Nonfatal Outcomes, Incidence of Hypertension, and Blood Pressure Changes in Relation to Urinary Sodium Excretion http://jama.ama-assn.org/content/305/17/1777
- ↑ 18.0 18.1 Caffeine dehydration : Caffeine and alcohol - just how dehydrating are they? http://www.pponline.co.uk/encyc/caffeine-dehydration.htm
- ↑ Metabolic and exercise endurance effects of coffee and caffeine ingestion http://jap.physiology.org/cgi/content/full/85/3/883
- ↑ Effects of caffeine ingestion on body fluid balance and thermoregulation during exercise http://www.ncbi.nlm.nih.gov/pubmed/2383801
- ↑ Caffeine ingestion and fluid balance: a review. http://pt.wkhealth.com/pt/re/jhnd/abstract.00009862-200312000-00004.htm;jsessionid=KNhWhGQSZnXhY11p2f7qnnmn1Q7z376shvhsK7hTWDLVGQhWpGGJ!811725889!181195628!8091!-1
- ↑ 22.0 22.1 Clinical Studies in Fluid and Electrolyte Balance
- ↑ Sensitivity and specificity of clinical signs for assessment of dehydration in endurance athletes http://bjsm.bmj.com/content/early/2010/04/22/bjsm.2008.053249.abstract
